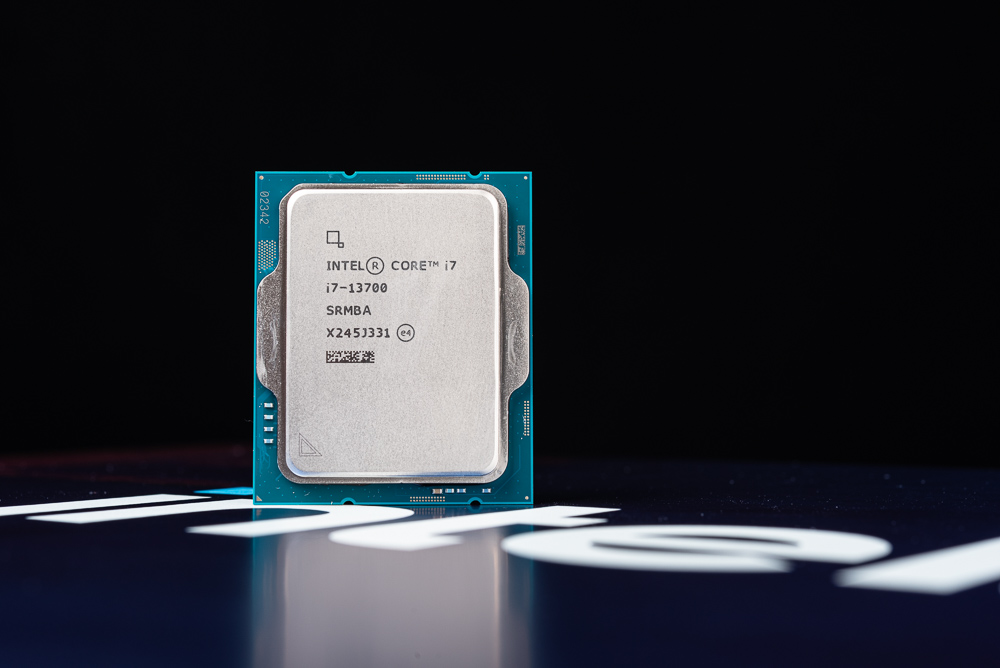
Intel has released its 13th generation Core desktop processors, including the non-K versions of i9-13900, i7-13700, i5-13600 / i5-13500 / i5-13400 and i3-13100, as well as F versions without integrated graphics. This provides a wider range of processor options for users on the new platform. In this context, the high-end mainstream computer performance and 1080p gaming performance of the Intel Core i7-13700 processor were tested.
The 13th generation Intel Core 65W desktop processor is officially launched
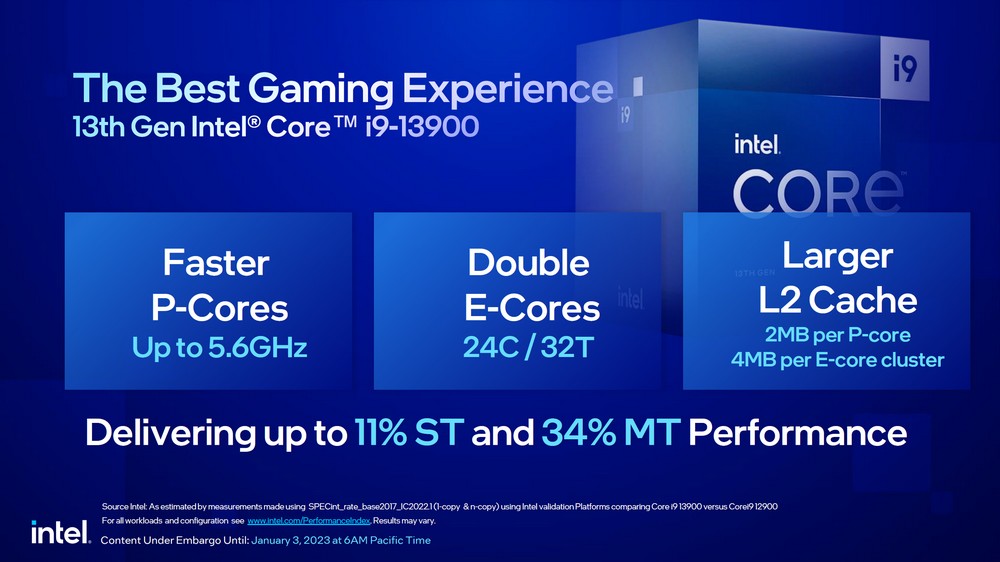
Compared to its predecessor, the 13th generation Intel Core processor features a higher P-Core clock, twice the E-Core speed, and a larger L2 cache. The non-K 65W version shares the same specifications as its K-series counterpart but differs in terms of clock frequency, power consumption, and price.
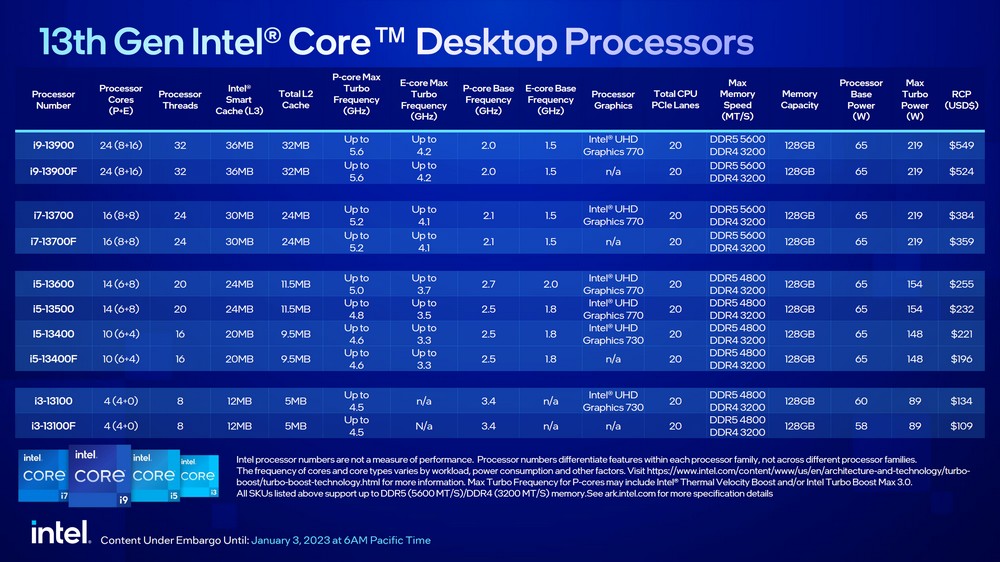
The i9-13900 has 8 P-cores and 16 E-cores with a total of 24 cores and 32 threads. It has a maximum Turbo speed of 5.6 GHz for P-cores and 4.2 GHz for E-cores, with a power consumption limit of 65W for basic power and 219W for maximum Turbo power. Its price is $549. The i7-13700, which was tested, has 8 P-cores and 8 E-cores with a total of 16 cores and 24 threads. It has a maximum Turbo speed of 5.2 GHz for P-cores and 4.1 GHz for E-cores, with the same basic power consumption of 65W and maximum Turbo power consumption of 219W. Its price is $384.
The entry-level i5-13600 has 6 P-cores and 8 E-cores with a total of 14 cores and 20 threads. It has a maximum Turbo speed of 5.0 GHz for P-cores and 3.7 GHz for E-cores, with the same basic power consumption of 65W and maximum Turbo power consumption of 219W. Its price is $255. On the other hand, the i5-13500 has lower clock speeds of 4.8 GHz for P-cores and 3.5 GHz for E-cores but is relatively cheaper at a price of $232.
The cheaper i5-13400 has 6 P-cores and 4 E-cores with a total of 10 cores and 16 threads. It has a maximum Turbo speed of 4.6 GHz for P-cores and 3.3 GHz for E-cores, which is similar to the previous generation’s specifications. Its basic power consumption is 65W, and its maximum Turbo power consumption is 148W, and it is priced at $221. If the budget permits, it is recommended to opt for the i5-13500 instead. As for the i3-13100, its 4-core and 8-thread specifications may be underwhelming, and it is primarily used for online activities despite being very affordable.
Test platform and settings
The main focus of this test is on the Intel Core i7-13700 processor, which was paired with the Ryzen 7900 and 7700 processors, both of which are also positioned at 65W. The objective of this comparison is to help users gain a better understanding of the performance differences between processors with similar specifications and prices, in order to make an informed decision when selecting a processor.
Test Platform
Processor: Intel Core i7-13700, AMD Ryzen 7900, 7700
Motherboard: ASRock Z790 Taichi, ASUS ROG CROSSHAIR X670E HERO
Memory: CORSAIR DOMINATOR PLATINUM RGB DDR5 32GBx2 5200MHz
Display Card: AMD Radeon RX 7900 XTX
System Disk: Solidigm P41 Plus 1TB PCIe 4.0 SSD
Radiator: 360mm AIO water-cooled radiator
Power supply: Seasonic PRIME PX-1000
Operating system: Windows 11 Pro 22H2
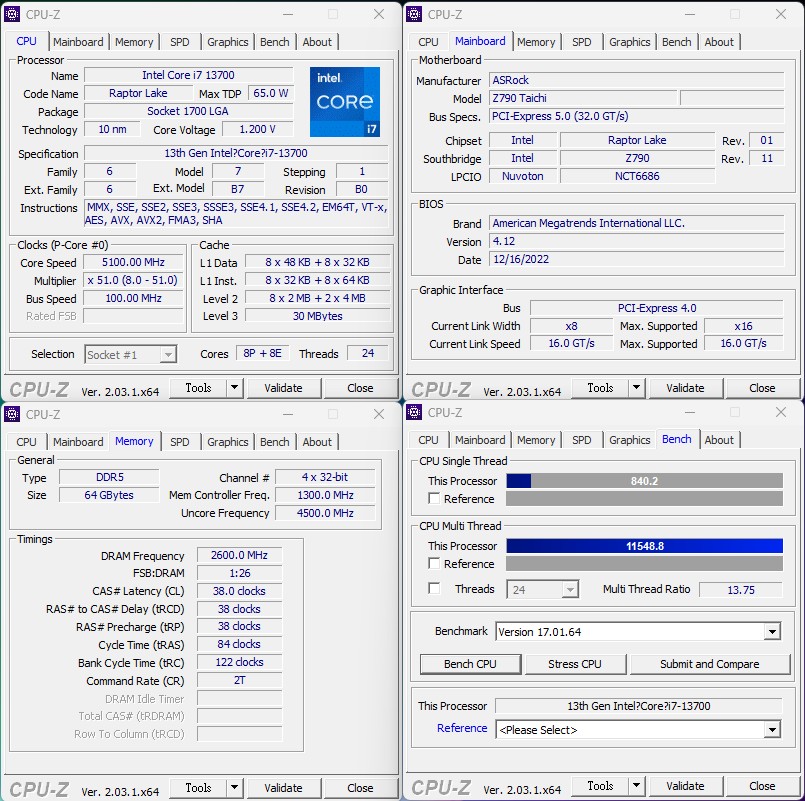
According to the CPU-Z information, the Intel Core i7-13700 processor is code-named Raptor Lake and is based on the 10nm manufacturing process. It was paired with an ASRock Z790 Taichi motherboard and had 32GB DDR5 memory running at a speed of 5200MHz, supplied by CORSAIR.
Processor Computing Performance Cinebench, VRay Rendering Test
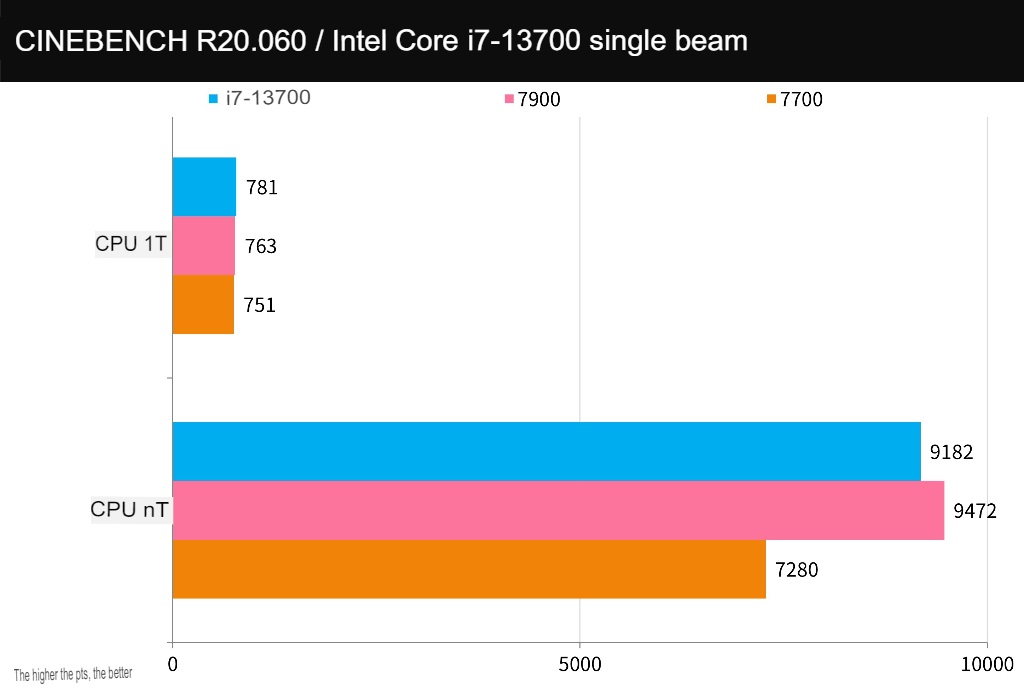
CINEBENCH R20, which was developed by MAXON based on Cinema 4D, is a reliable software used for evaluating computer processor performance in 3D rendering. It is also capable of providing a quick assessment of a CPU’s multi-core computing performance.
The i7-13700 scored 9182 in the nT multi-threaded test and 781 in the 1T single-threaded test. Compared to the 7900, its multi-core performance was 3.1% lower but approximately 26.1% better than the 7700’s multi-core performance. However, it had a clear advantage in single-core performance.
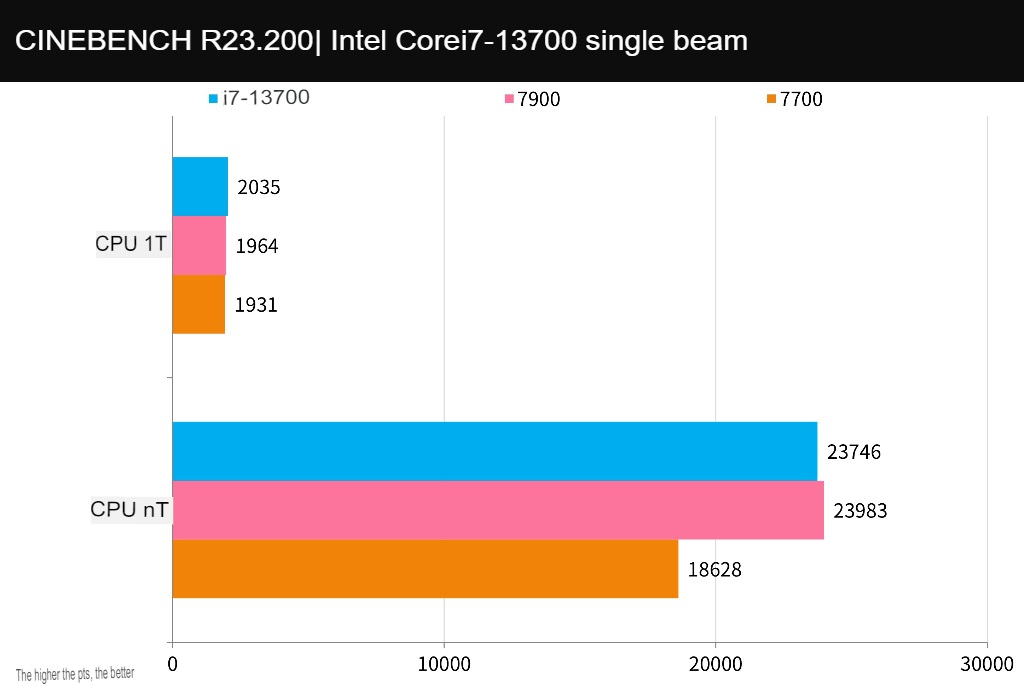
CINEBENCH R23 uses the same testing situation as R20 but features a new compiler and a stress test function that allows users to customize the Minimum Test Duration, such as 10 or 30 minutes, to assess the stability of their computer. However, the results obtained from R23 cannot be directly compared to those of R20.
In the nT multi-threaded test, the i7-13700 scored 23746 points, while it scored 2035 points in the 1T single-threaded test. In comparison to the 7900, its multi-core performance was slightly lower by 1% but was approximately 27.5% better than the 7700’s multi-core performance. Again, it had a clear advantage in single-core performance.
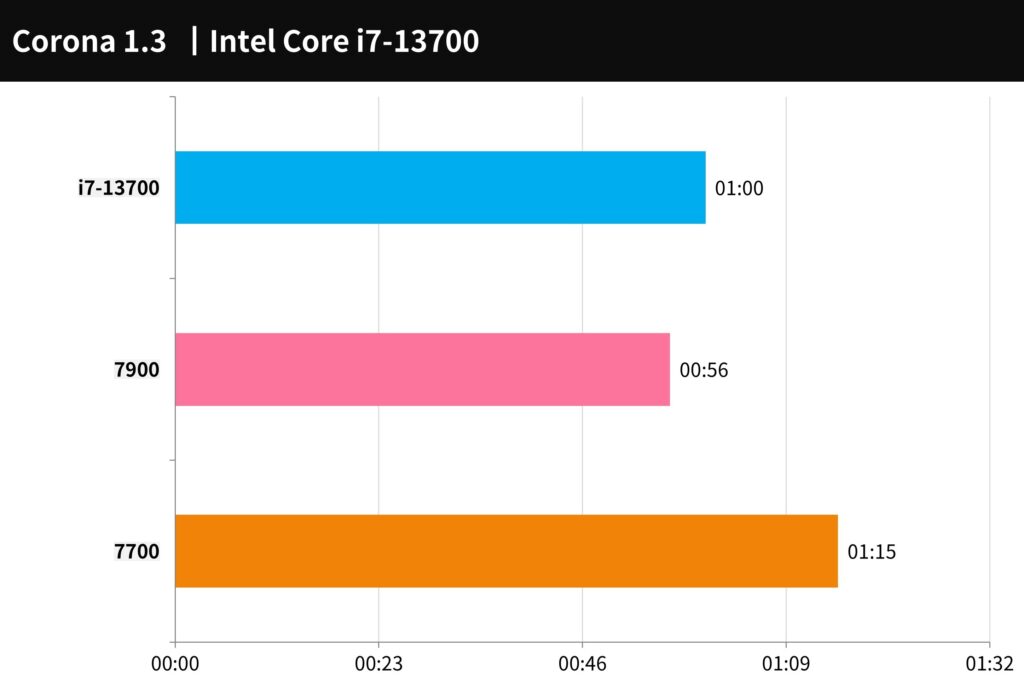
Corona Benchmark is a user-friendly tool used for testing processor performance. It uses the Corona Renderer 1.3 renderer to evaluate and compare a processor’s rendering speed and its Rays/s performance, which is scored in seconds.
In this test, the i7-13700 took 1 minute to complete the calculation, which is slower than the 7900 but faster than the 7700.
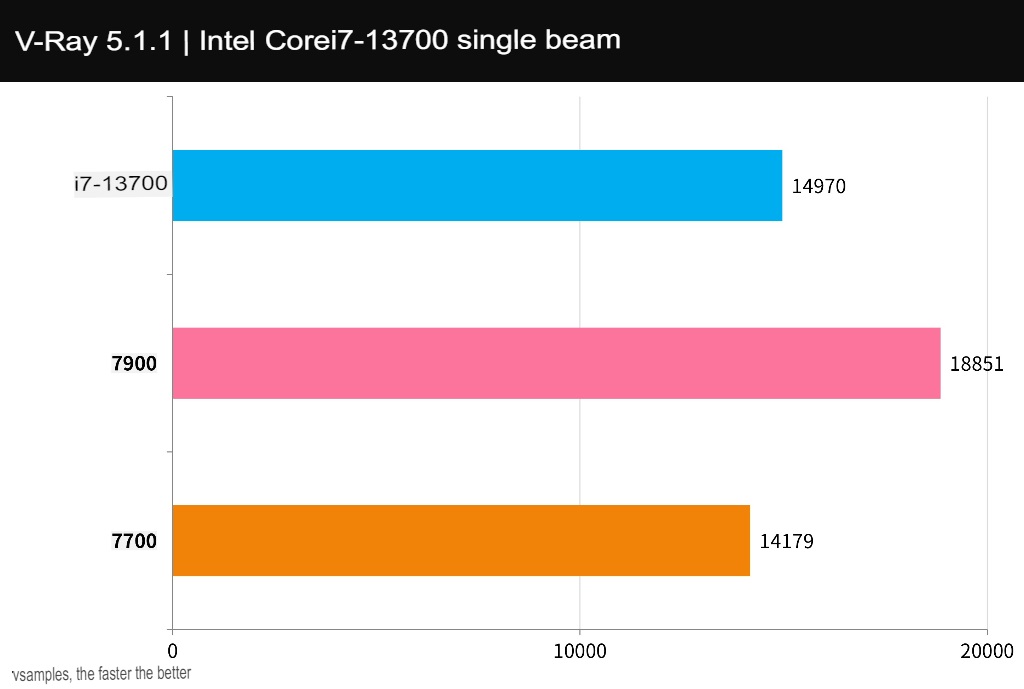
V-Ray Benchmark is a software tool developed by Chaos Group that uses V-Ray, a physically-based rendering software, to evaluate a CPU’s computing performance for ray tracing on images. The CPU score is measured in samples per second.
In this test, the i7-13700 scored 14970 points. It was found to be 20% lower in performance compared to the 7900 but approximately 5.6% better than the 7700.
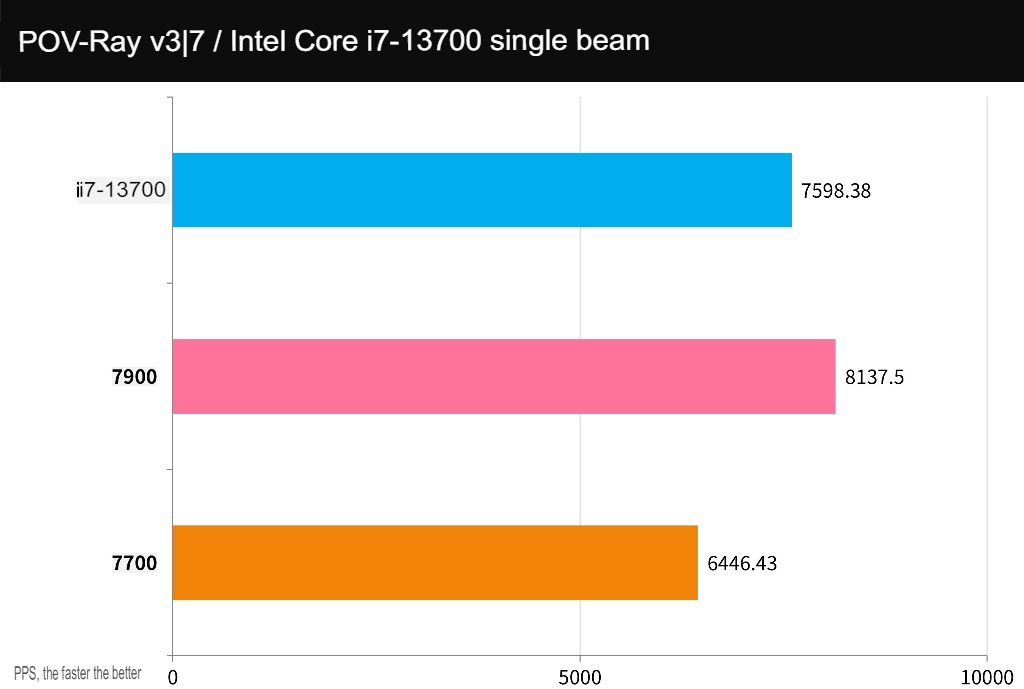
POV-Ray is a free 3D rendering tool that utilizes multi-core CPU computing power to calculate the rendering of light, shadow, and 3D images using ray tracing techniques.
In this test, the i7-13700 achieved a score of 7598.38. It was found to be 6.6% lower in performance compared to the 7900 but approximately 19.9% better than the 7700.
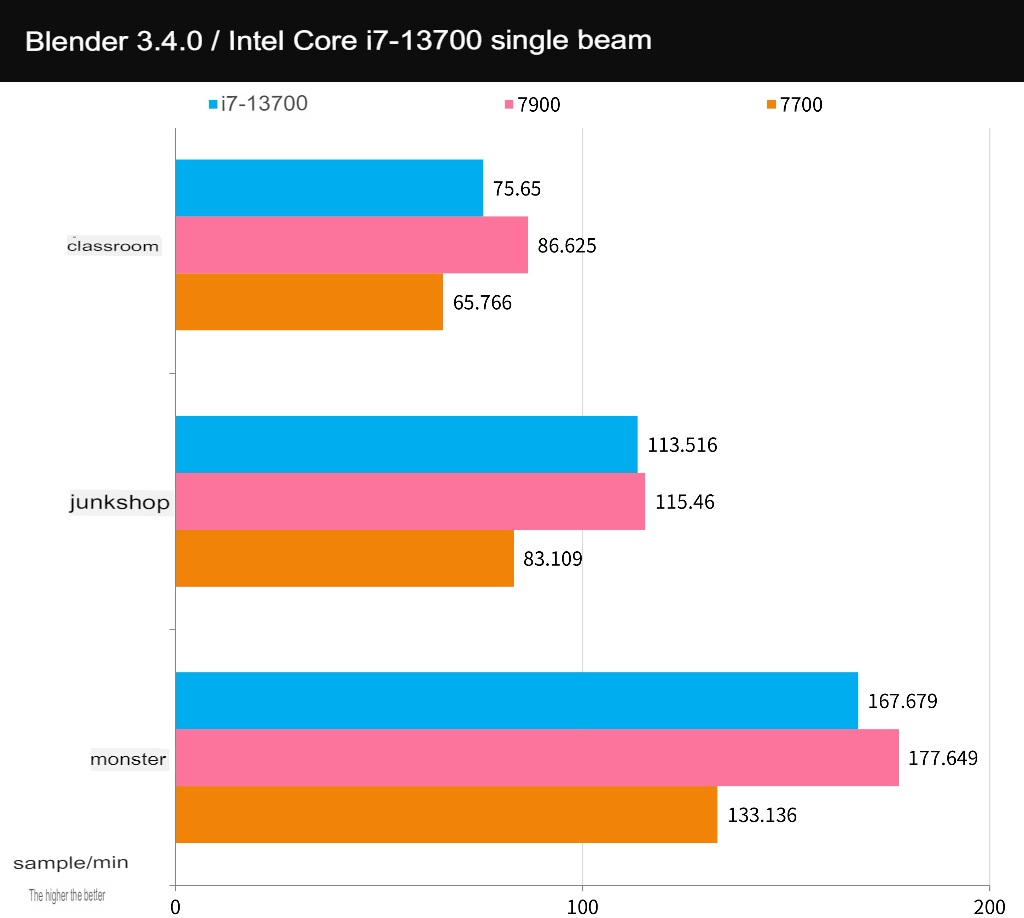
Blender is an open-source 3D creation tool that is available on various platforms. It supports CPU and GPU rendering acceleration functions, as well as various 3D operations such as modelling, rigging, animation, simulation, rendering, compositing, and motion tracking.
In the Blender Benchmark 3.4.0 test, three different scenarios were used: monster, junkshop, and classroom. The i7-13700 showed good performance, although it was slightly lower than the 7900, with an average performance difference of 6.7%. However, it outperformed the 7700 with an average performance difference of 25%.
Create PR image output, LR and PS photo editing performance test
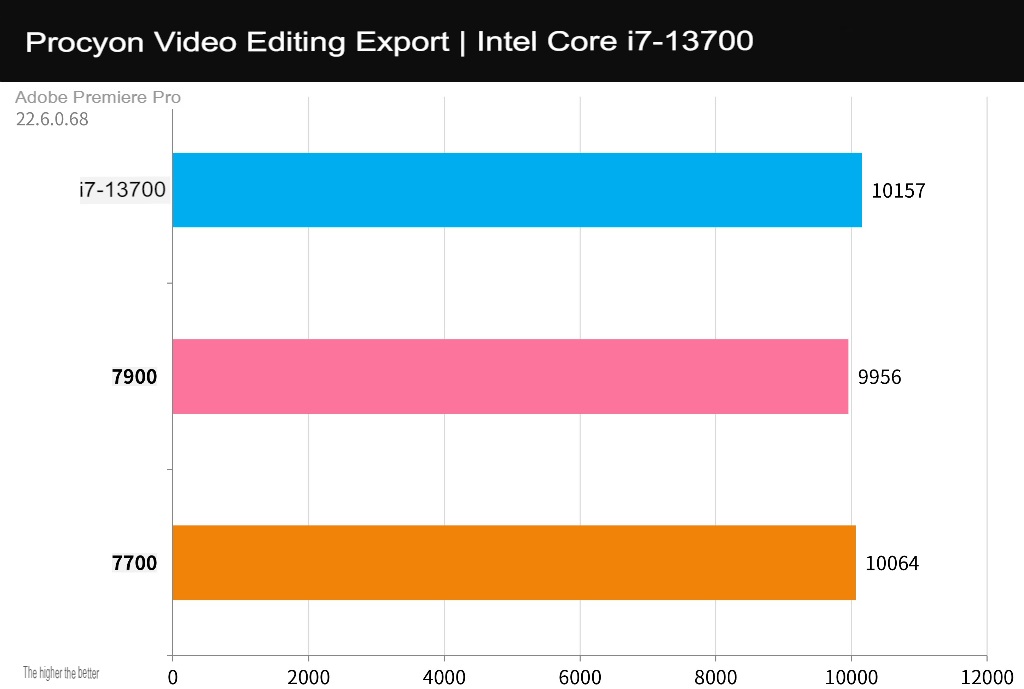
The UL Procyon Video Editing Benchmark tool was used to test the Adobe Premiere Pro 2020 conversion output. The test was conducted using 2160p 30/60 FPS videos, which were output in H.264 – YouTube 1080p Full HD and HEVC (H.265) – 4K UHD formats. The output performance of pure CPU output and GPU acceleration were compared, and the RX 7900 XTX graphics card was used for testing.
When comparing video output performance, the differences in CPU performance are relatively insignificant in the current situation of GPU acceleration. However, if video effects that can only be calculated by the CPU are used or if editing operations and playback are included in the test, it is possible to observe obvious differences in performance between different CPUs.
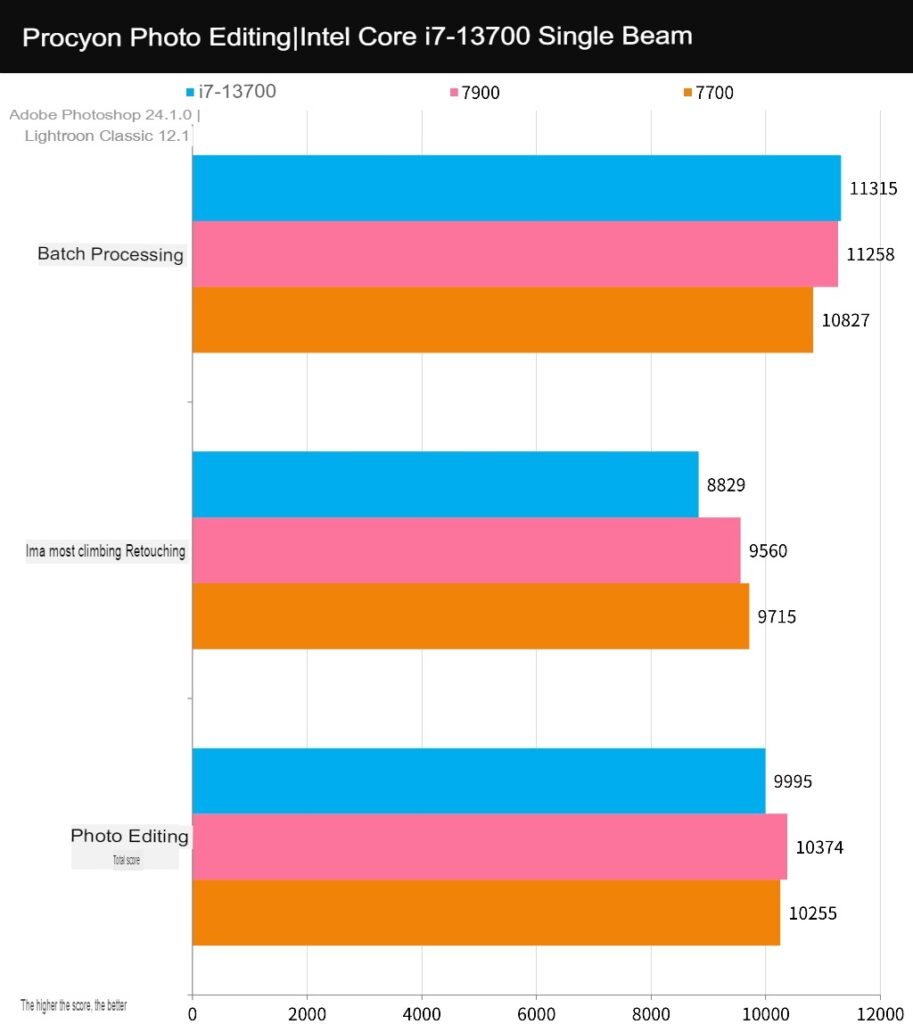
The UL Procyon Photo Editing Benchmark tool was used to test Adobe Photoshop and Lightroom Classic. The test included two working conditions: the Image Retouching test involved using Photoshop to edit photos and record the time required for each step, while the Batch Processing test involved using Lightroom to adjust a large number of photos in batches with output.
The i7-13700 achieved a total score of 9995, which was slightly lower than the scores achieved by the 7900 and 7700 in all tests. It can be observed that AMD processors generally have better performance in this test.
AIDA64 processor memory, 7-Zip compression test
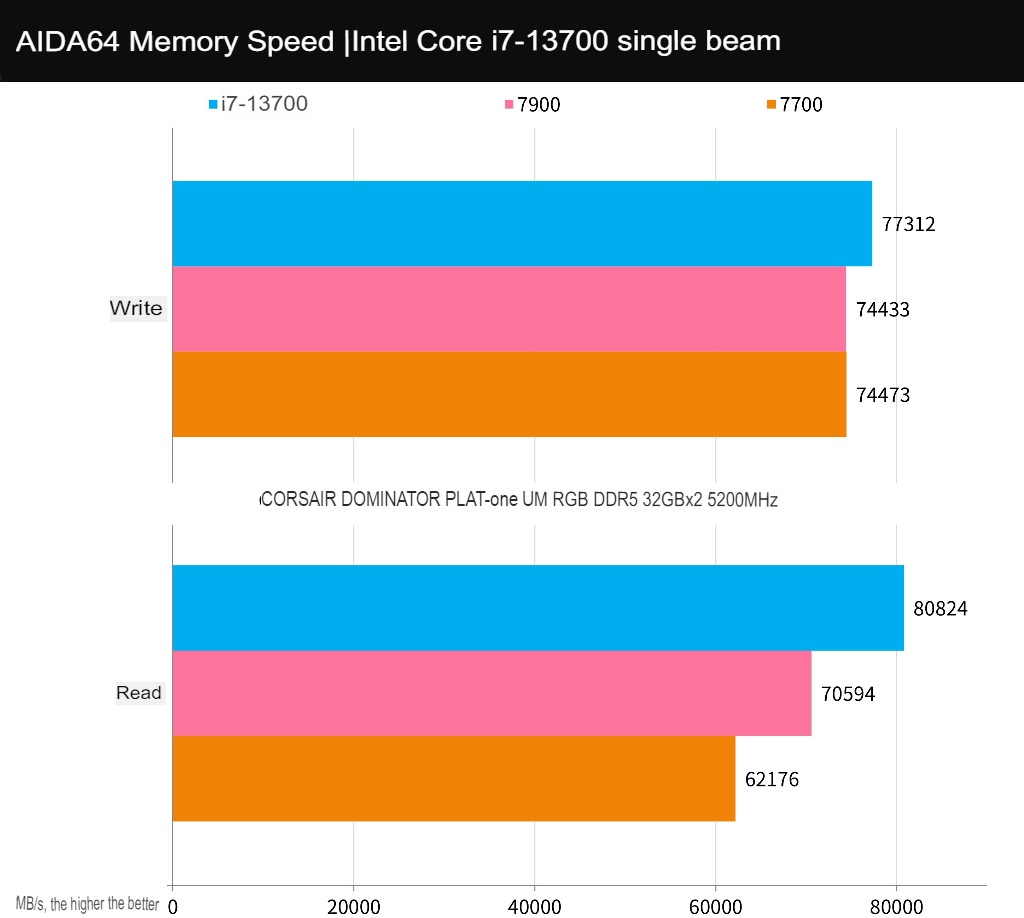
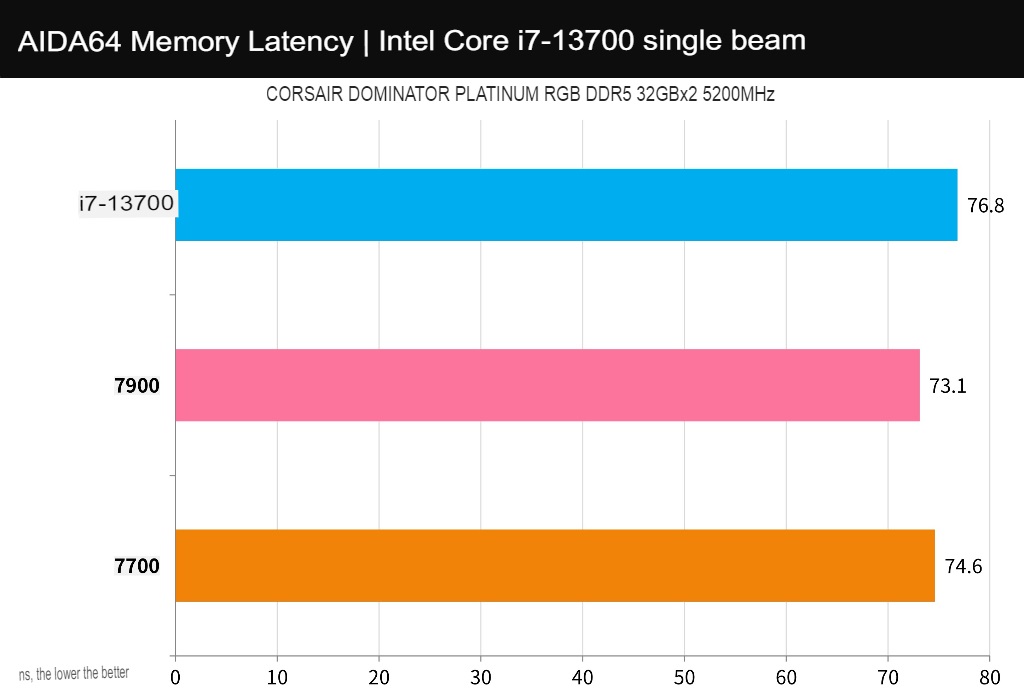
The AIDA64 software was used to test the memory performance of the system, with the CORSAIR DOMINATOR PLATINUM RGB DDR5 32GBx2 5200MHz memory being used. Intel processors typically have better memory performance compared to other architectures. In this test, the memory read speed was 80824 MB/s, the write speed was 77312 MB/s, and the latency was 76.8ns.
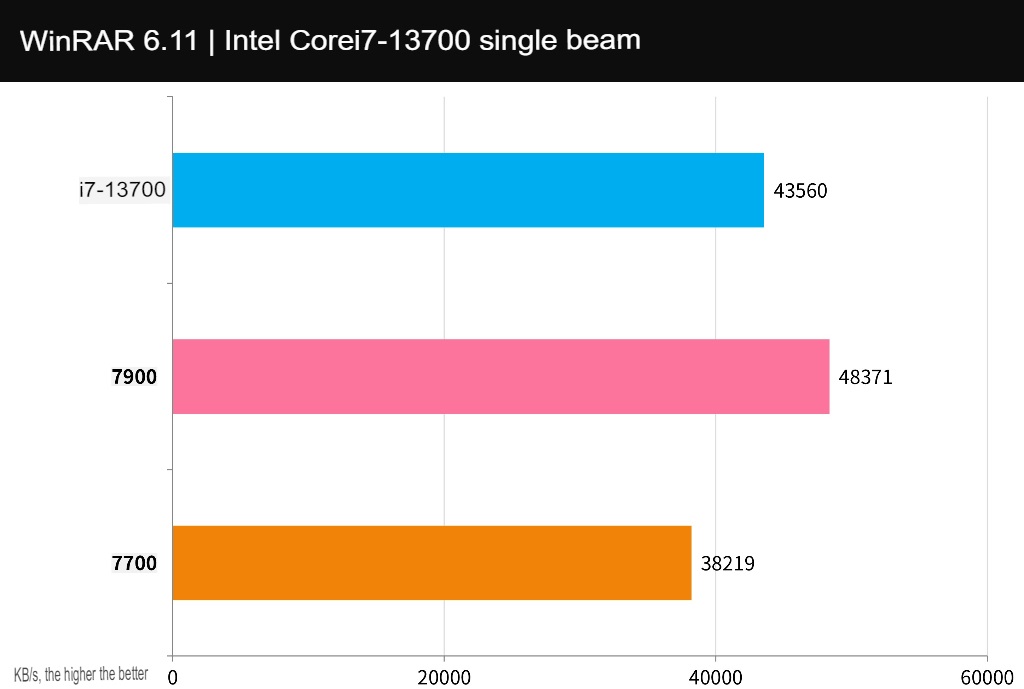
WinRAR is a commonly used compression tool, and the i7-13700 achieved a compression speed of 43560 KB/s.
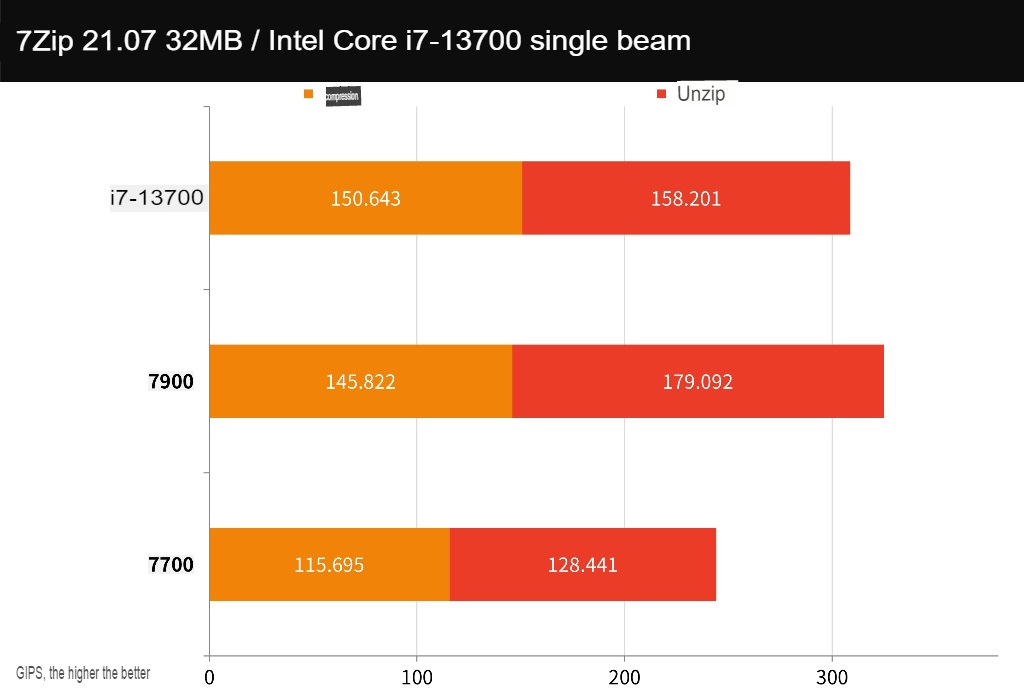
7-Zip is another popular compression tool that is known for its ability to utilize the performance of multiple cores effectively. In this test, the i7-13700 achieved a compression speed of 150.6 GIPS and a decompression speed of 158.2 GIPS.
PCMark 10, CrossMark and Office computer performance test
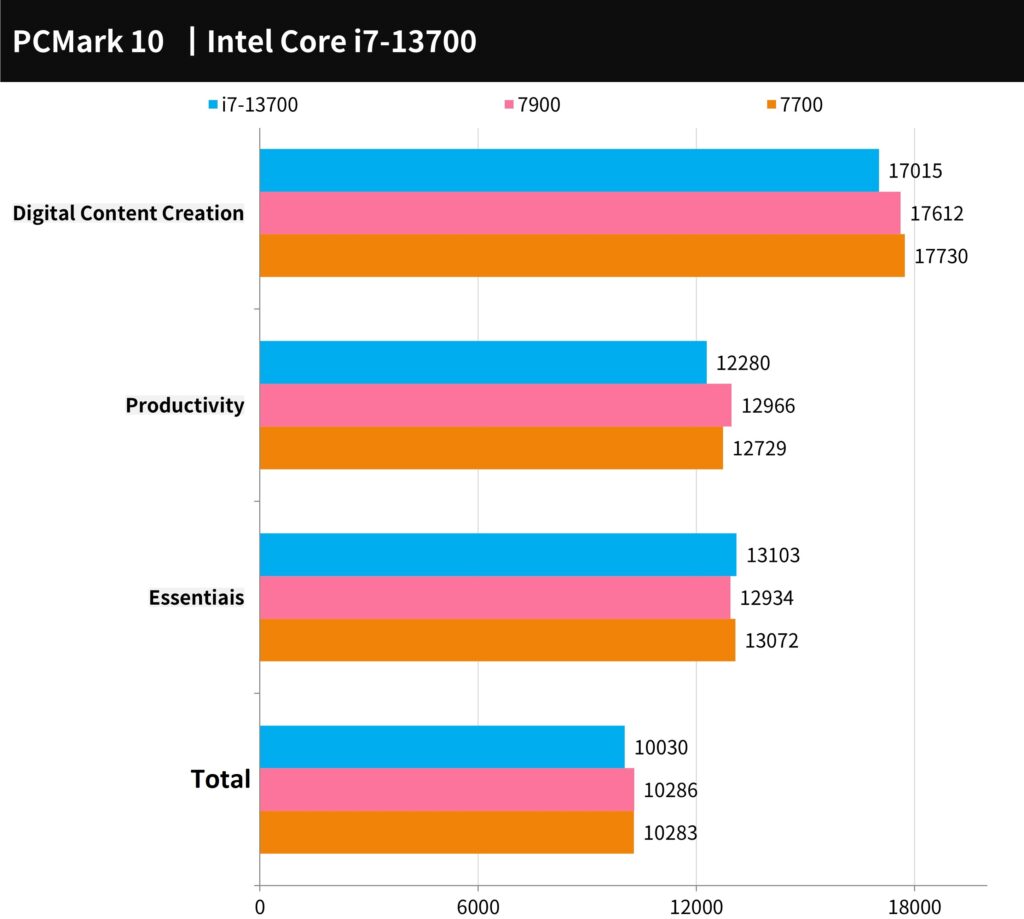
PCMark 10 was used to evaluate the overall performance of the computer, and the test was conducted on three different scenarios: Essentials, Productivity, and Digital Content Creation. The Essentials test evaluated basic computer work such as application startup speed, video conferencing, and web browsing performance. The Productivity test evaluated spreadsheet work and paperwork, while the Digital Content Creation test evaluated photo/video editing, rendering, and visualization.
The i7-13700 achieved a total score of 10030 points. These processors are suitable for fulfilling basic tasks such as Internet access and paperwork. However, it was found that AMD processors generally have an advantage in this test.
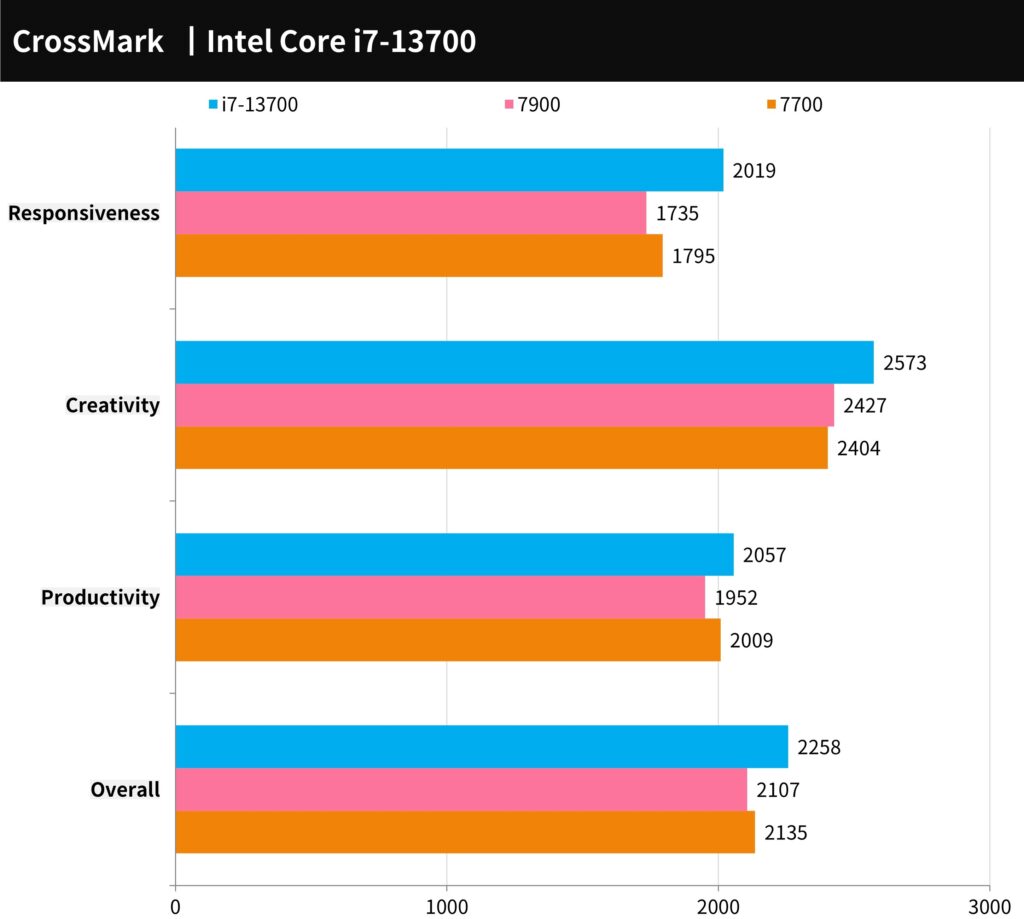
CrossMark is a free, cross-platform computer performance testing tool developed by BAPCo. It supports various platforms such as Windows, iOS/iPadOS, macOS, and Android. It evaluates computer productivity in areas such as text editing, spreadsheets, web browsing, and creative photo and video editing, as well as computer response speed.
In this test, the i7-13700 achieved a score of 2258 points. The addition of the computer response test item allowed the Intel processor’s inherent memory advantage and higher CPU clock speed to significantly improve the overall performance.
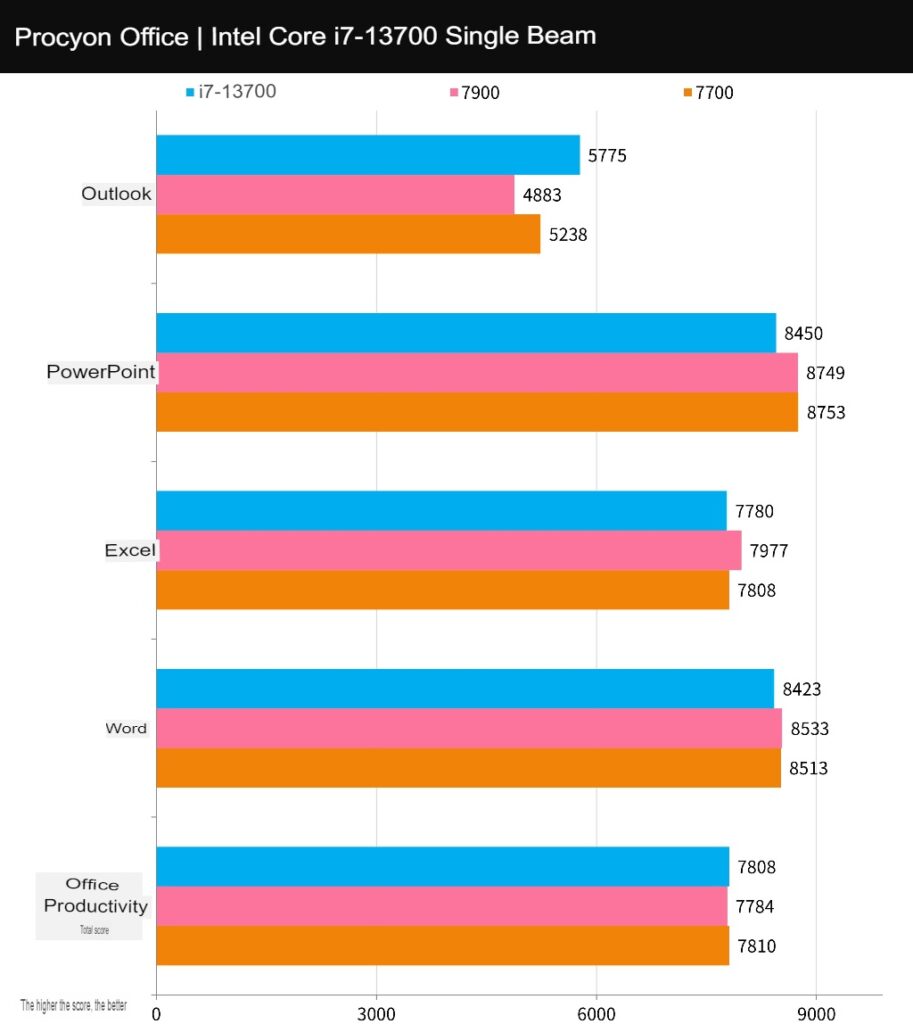
The UL Procyon office productivity benchmark test evaluates the practical and real-world performance of Windows computers in daily work using Microsoft Word, Excel, PowerPoint, and Outlook. It simulates common paperwork scenarios, including document opening, copying, input, spreadsheet calculation, sorting, exporting, adding files, image files, and videos, and sending and receiving emails and presentations.
In this test, the i7-13700 achieved a score of 7808 points. The performance difference in paperwork scenarios may not be significant for general use, but a CPU with a higher clock speed will have a higher score.
3DMark CPU Performance and FS, TS Benchmark Test
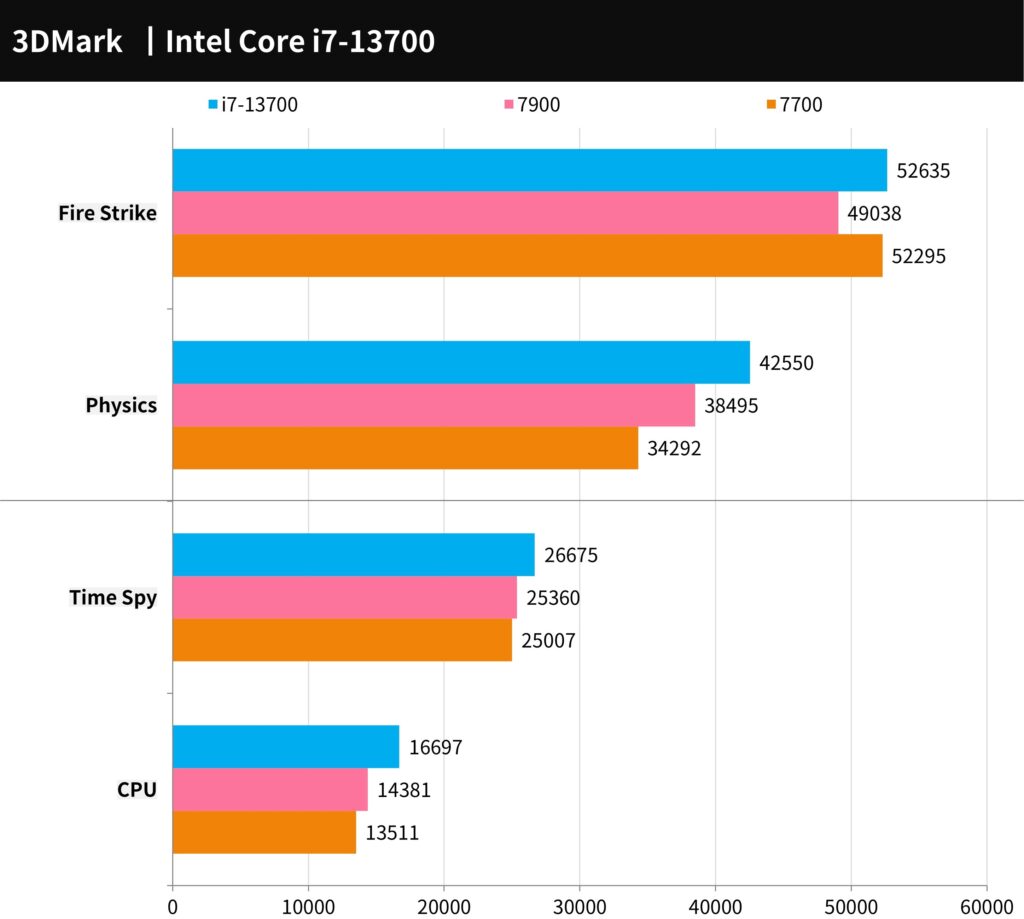
The computer graphics game performance test tool 3DMark was used to evaluate the performance of the system in the mainstream Direct X11 test Fire Strike and Direct X12 Time Spy test.
In the Fire Strike Physics project, the performance is heavily dependent on the CPU, and a higher clock speed results in higher performance. The i7-13700 achieved a physics score of 42550. In the DX12 Time Spy CPU test, the i7-13700 scored 16697 points.
The 3DMark CPU test evaluates the physical calculation and custom simulation work of the CPU and tests the processor’s performance in 1, 2, 4, 8, 16, and maximum execution thread scenarios. Performance above 16 execution threads falls under 3D rendering, and audio and video output tests are used. Generally, Direct X12 games tend to favour 8-thread execution, while older games tend to prefer lower thread counts.
In this test, the performance of the processors in the 1T-4T range is quite close, but the performance gap widens as the thread count increases to 8T and above. The i7-13700 demonstrates an advantage above 16T.
9+2 AAA e-sports games for processor performance test
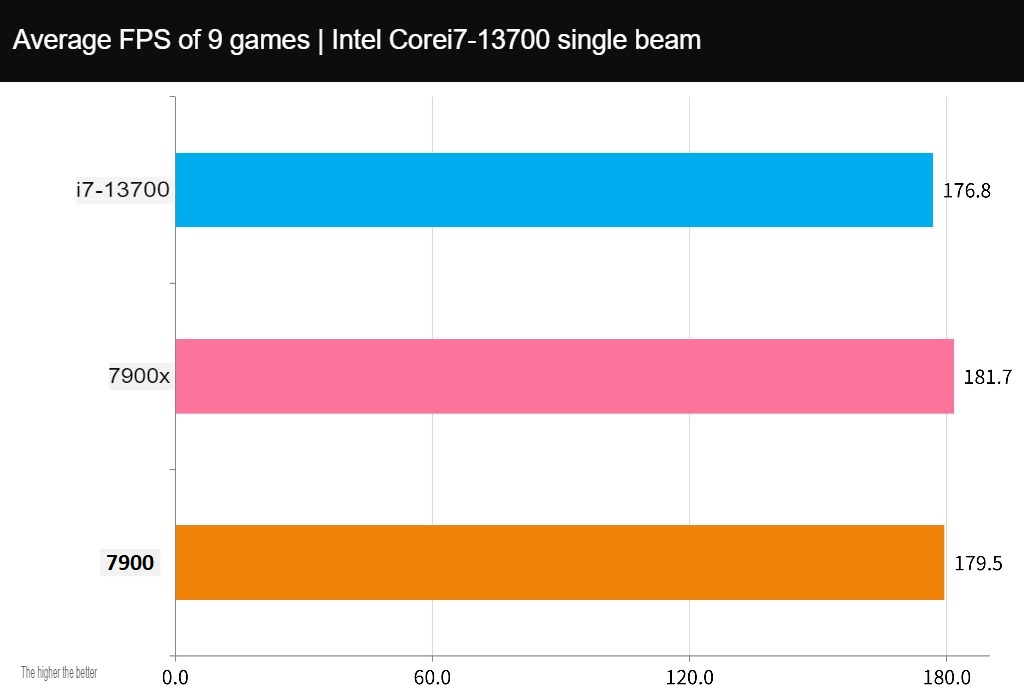
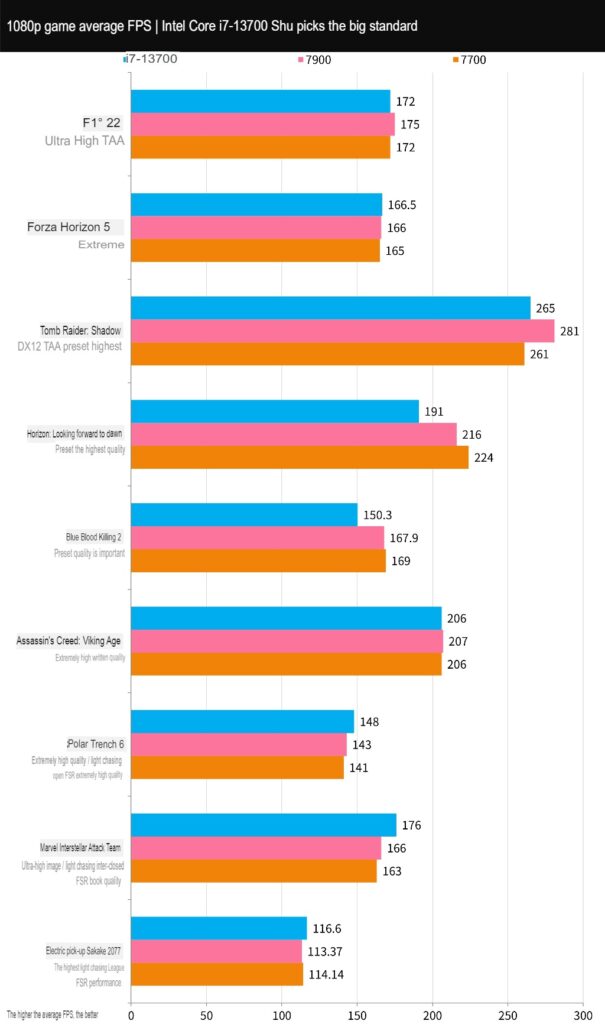
Nine AAA games were tested to evaluate the i7-13700’s gaming performance. These games include “F1® 22”, “Forza Horizon 5”, “Shadow of the Tomb Raider”, “Horizon: Zero Dawn”, “DOOM Eternal”, “Assassin’s Creed: Valhalla”, “Metro Exodus”, “Marvel’s Avengers”, and “Cyberpunk 2077”.
All tests were performed using the In-Game Benchmark with a resolution of 1080p and the game’s highest default settings. In these tests, the i7-13700 achieved an average of 176.8 FPS, and overall, it slightly trailed the 7900 and 7700 in gaming performance.
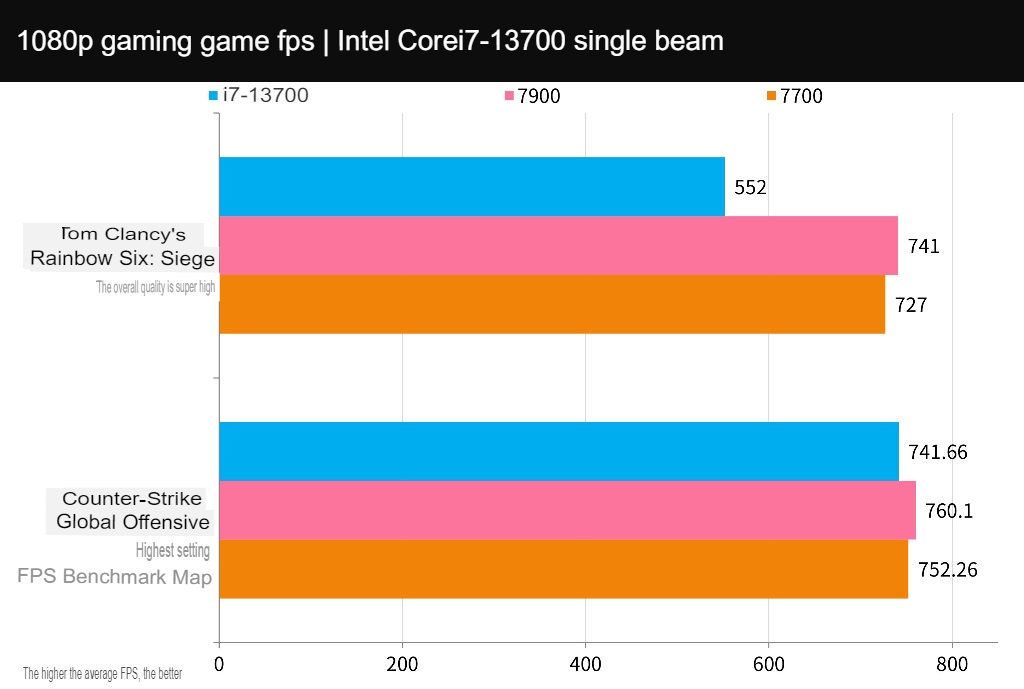
The focus of e-sports games is on tactical and technical competition between players and teams, and they do not have high requirements for game graphics quality. This allows e-sports games to achieve fairly high average FPS performance on high-end CPUs and GPUs, especially at 1080p resolution. Improved CPU performance and clock speed can greatly enhance the FPS performance of such games.
The test used two games, “Counter-Strike: Global Offensive” (CS: GO) and “Tom Clancy’s Rainbow Six: Siege” (R6), and tested at 1080p resolution with the game’s highest settings. The i7-13700 achieved 741.66 FPS in CS: GO and 552 FPS in R6.
Intel Core i7-13700 processor temperature and power consumption test
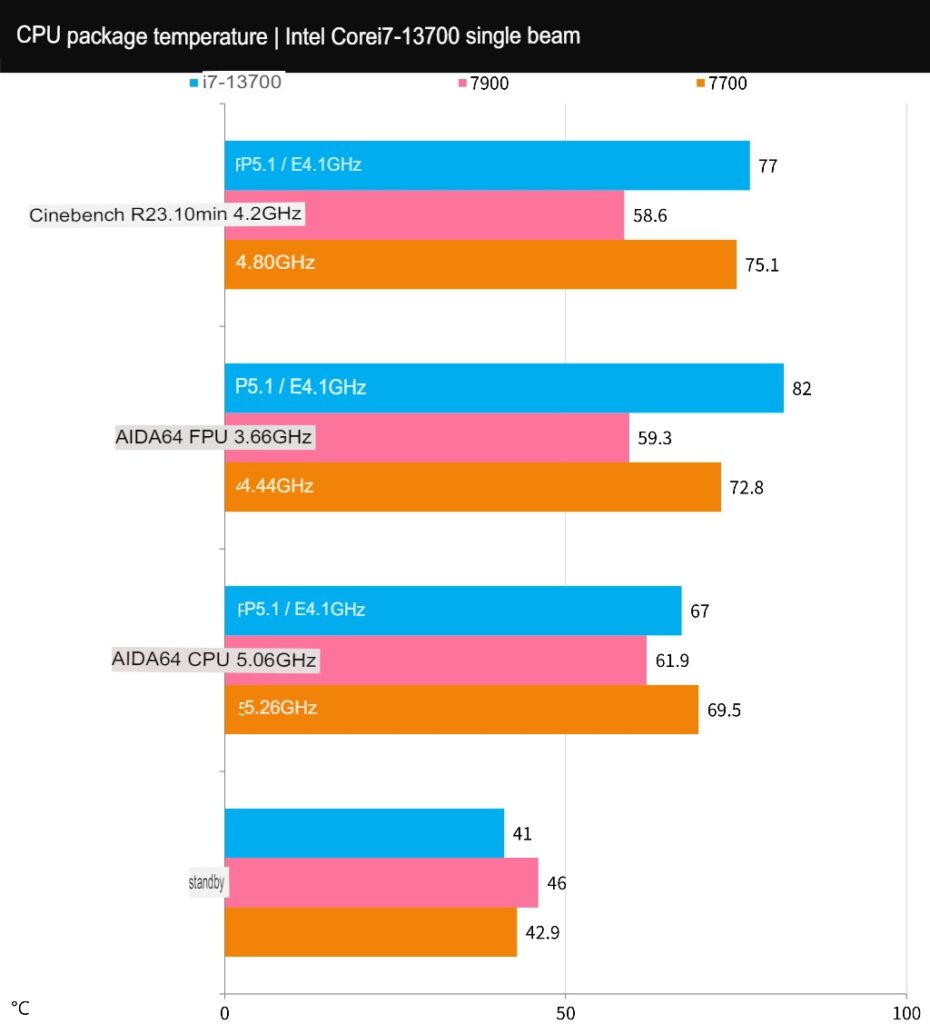
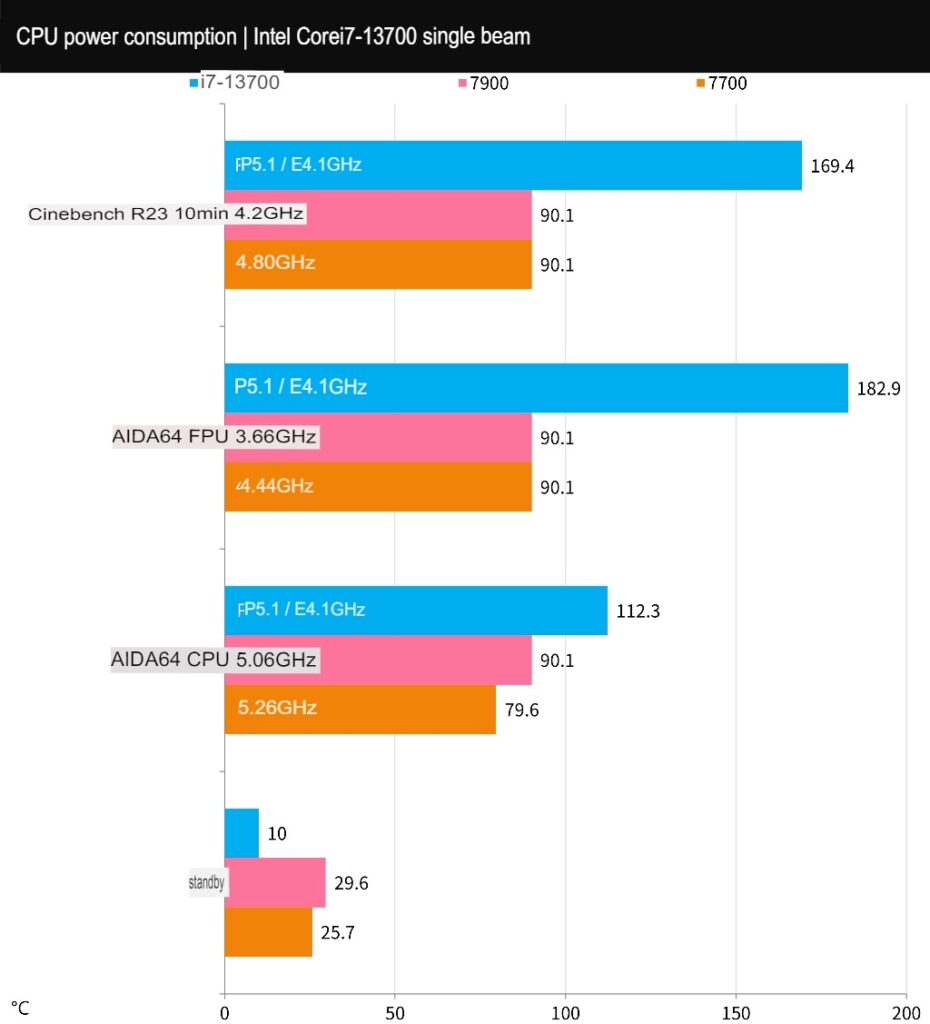
When conducting stress tests, AIDA64’s CPU and FPU burn-in tests are compared. Under normal computer usage, the temperature performance is closer to that of AIDA64’s CPU test. However, the FPU test places the highest load and consumes more power. During the tests, the i7-13700 processor reached a temperature of 67°C during the AIDA64 CPU stress test, 82°C during the FPU stress test, and 77°C during the Cinebench R23 stress test. The processor maintained a high clock speed of P5.1GHz / E4.1GHz throughout the tests. In terms of power consumption, the i7-13700 consumed 112W during the AIDA64 CPU stress test. However, during the maximum FPU test with unlocked power consumption, it reached an impressive 182.9W, surpassing even AMD’s obedient performance per watt of 90W.
Summarize
The Intel Core i7-13700 is priced at NT$ 13,000 in Taiwan, which may be considered somewhat uncompetitive. However, if you are willing to spend an additional $400-800, you can upgrade to the i7-13700KF, which offers better performance and overclocking capabilities. For non-overclocking gamers, the i7-13700 is still a solid choice with its 8P + 8E 16C24T specs and Turbo clock speeds of up to 5.1GHz (full-core P-core) and 4.1GHz (E-core). However, Intel’s power consumption remains higher than its AMD rivals at the same level.
The i7-13700 can compete with the 7900 and outperform the 7700, making its price point fall somewhere in the middle of the two processors. What’s more, the 12th and 13th generation Intel processors are compatible with the 600 and 700 series motherboards, providing a wider range of specifications to choose from when building a system. This flexibility in pricing allows players to choose the processor and platform that best fits their budget and needs.
If this article is helpful for you, please share this article with your friends on social media. Thank you!
This article is based on the personality of the reviews. You are responsible for fact-checking if the contents are not facts or accurate.
Title: Intel Core i7-13700 CPU performance evaluation / non-K variant competes at 65W power usage unlocked