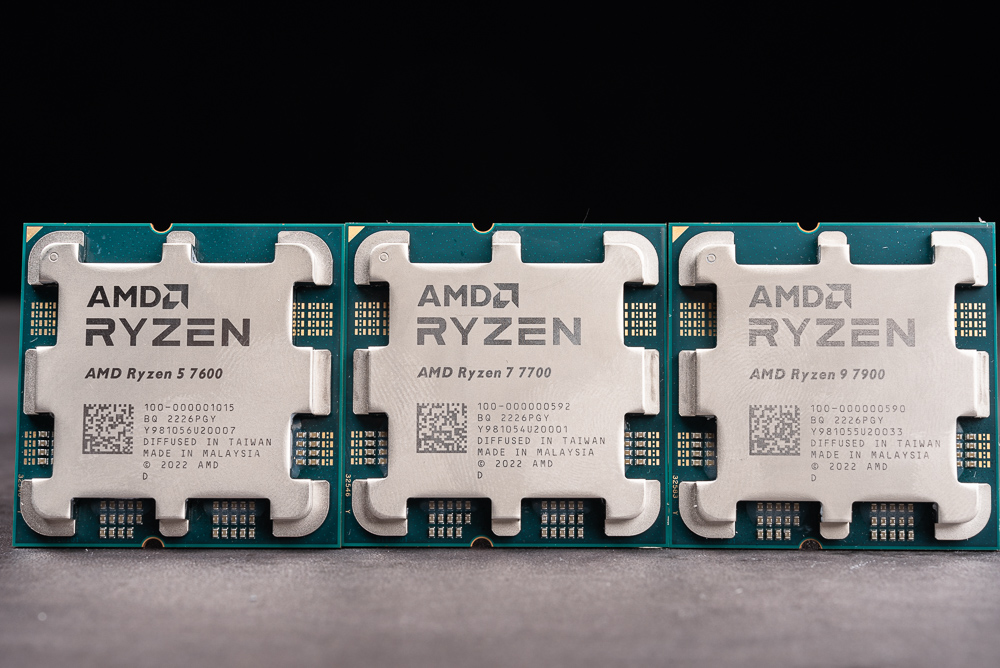
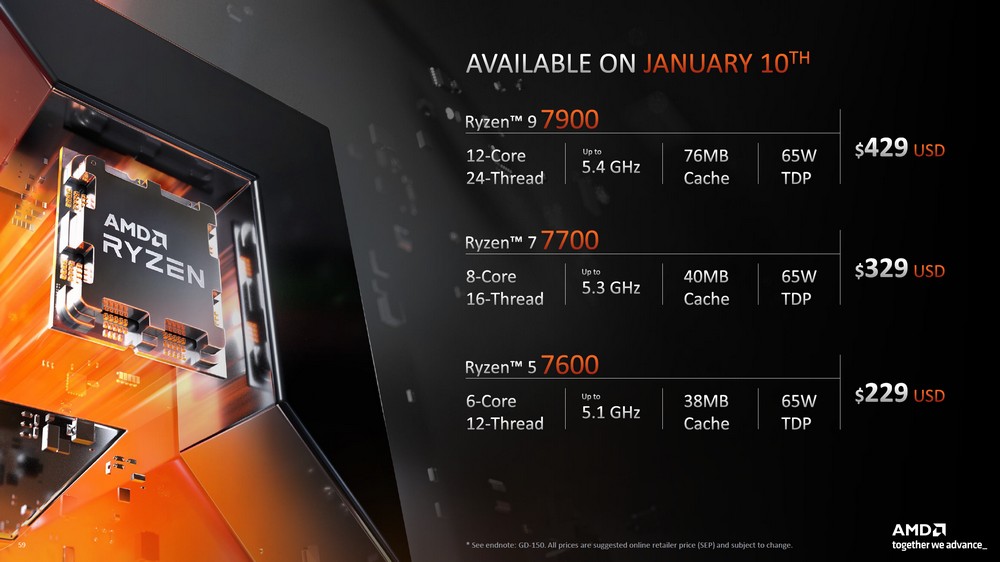
AMD unveiled a range of new products at this year’s CES Keynote, including the forthcoming Ryzen 7000 processor that will be released in February. The company also introduced the mainstream, entry-level 65-watt Ryzen 7000 processor series, which includes three processors: the Ryzen 7900, 7700, and 7600. These processors are equipped with AMD’s Faith cooler as standard and support PBO overclocking with an unlocked multiplier.
In February, the AMD Ryzen 7000 processor will be added to the 65-watt “new force” product line and features a 3D cache processor
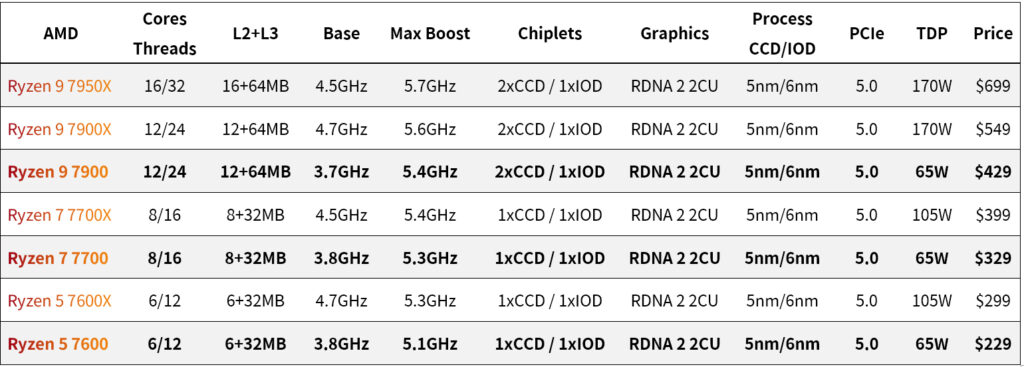
The AMD Ryzen 7000 processor is a 65-watt TDP mainstream and entry-level product featuring 12 cores and 24 threads in the Ryzen 9 7900, with a maximum Boost clock of 5.4GHz. The Ryzen 7 7700 includes 8 cores and 16 execution threads with a Boost clock of up to 5.3GHz, and the Ryzen 5 7600 includes 6 cores and 12 execution threads with a clock frequency of up to 5.1GHz.
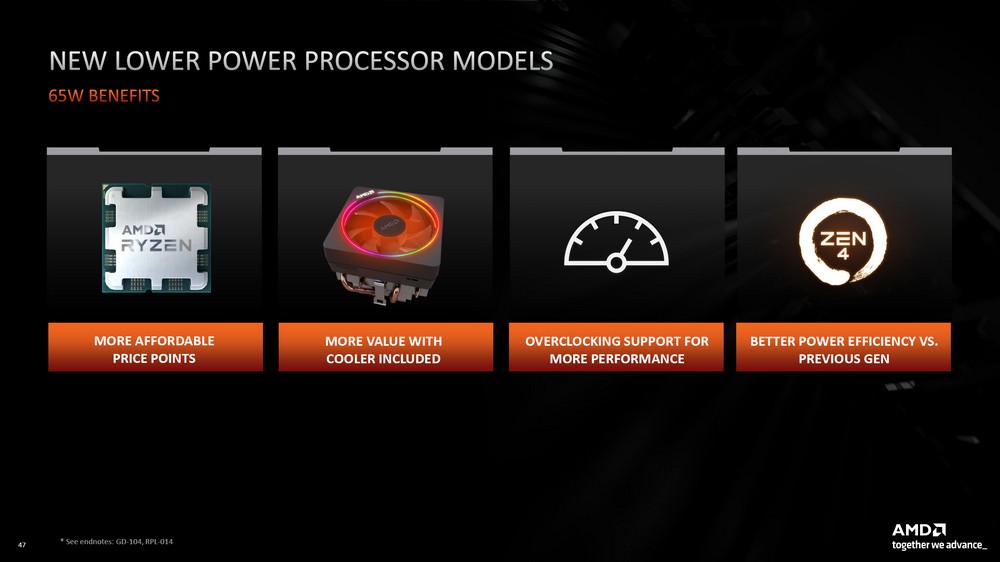
The Ryzen 7000 generation processors are based on the Zen 4 micro-architecture, a 5nm process core, a 6nm I/O die, and the new AM5 platform. They also include an RDNA 2 2CU internal display, particularly useful for 65-watt entry-level processors. When building a budget-conscious computer for internet use, the cost savings from not having to purchase a dedicated graphics card can be put towards upgrading RAM or adding an SSD, making the system even more valuable.
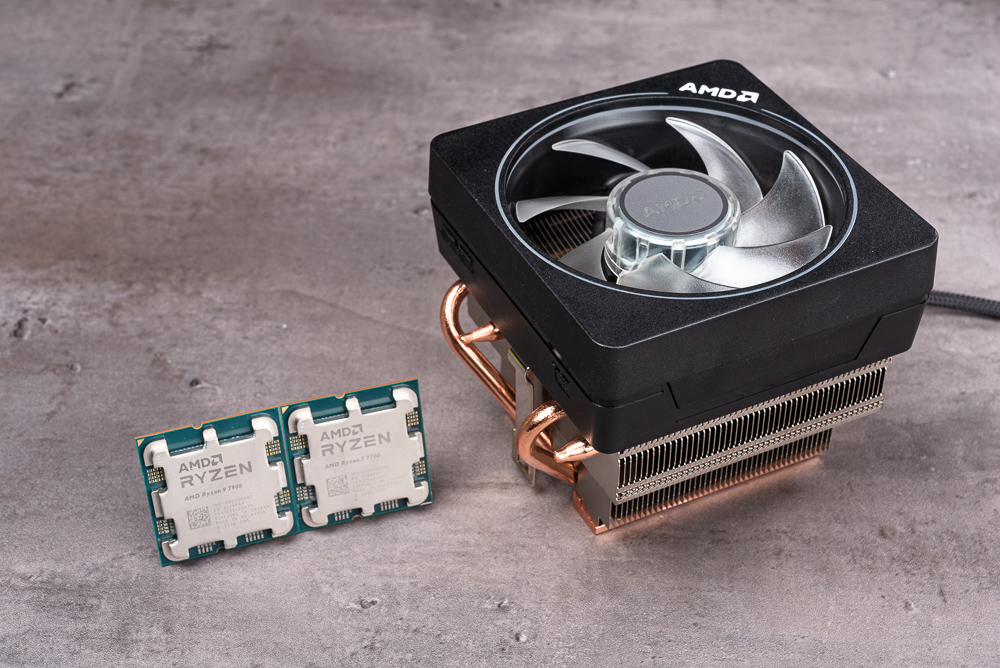
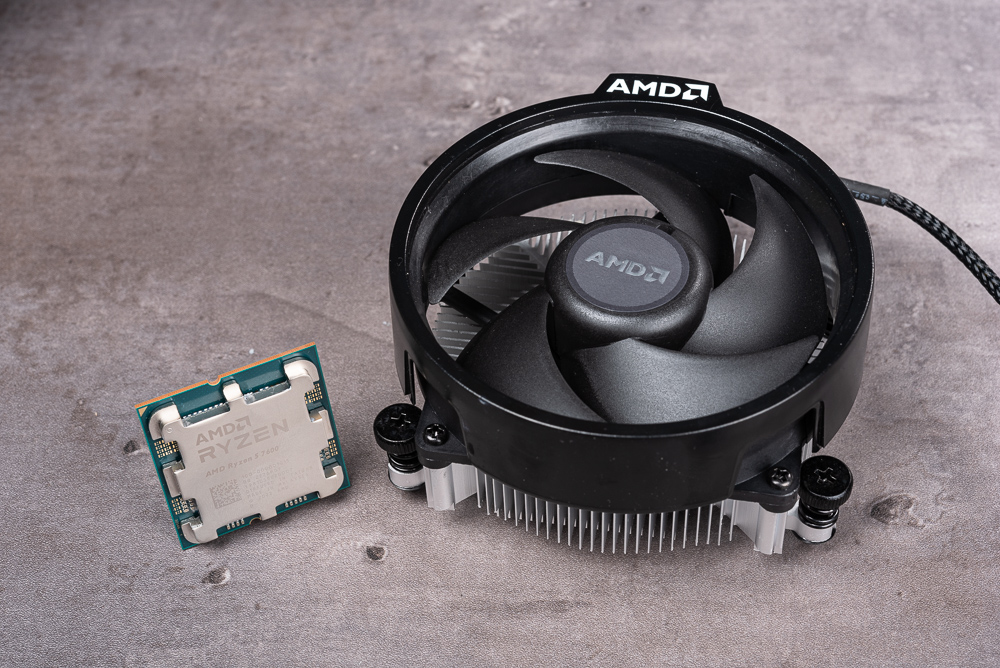
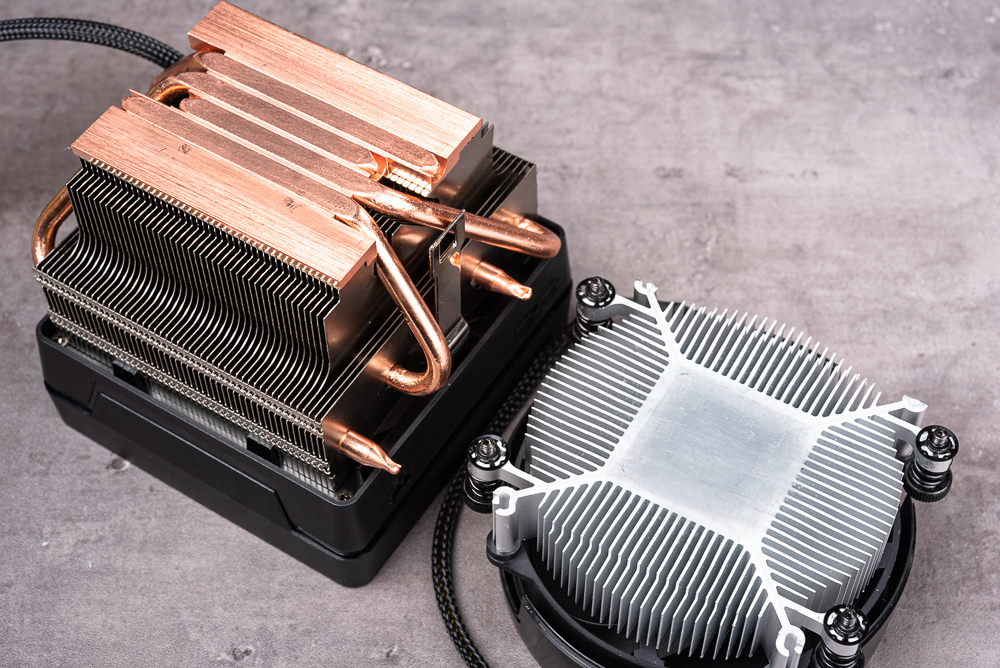
The Ryzen 9 7900 and Ryzen 7 7700 come with the AMD Wraith Prism RGB cooler as standard, while the Ryzen 5 7600 comes with the Wraith Stealth cooler. Even at 65 watts, these processors support PBO overclocking. Gamers looking for a more cost-effective solution can switch to an AIO water cooler to unlock PBO overclocking and achieve higher performance.
Test platform and settings
This test primarily focuses on the performance of the Ryzen 7000 family of processors. In addition to the newly released Ryzen 7900, 7700, and 7600, the test also includes the X-series processors: the Ryzen 7950X, 7900X, 7700X, and 7600X. This allows players to compare the performance of these processors in the same generation more easily.
The Ryzen 7900 and 7700 processors come with Wraith Prism RGB coolers, while the 7600 comes with a Wraith Stealth cooler. The X-series processors, including the Ryzen 7950X, 7900X, 7700X, and 7600X, come with AIO 360mm water coolers. All the processors in the test use DDR5-5200 XMP memory settings. The test platform is included below for reference.
Test Platform
Processor: AMD Ryzen 9 7950X, 7900X, 7900, 7700X, 7700, 7600X, 7600
Motherboard: ASUS ROG CROSSHAIR X670E HERO
Memory: CORSAIR DOMINATOR PLATINUM RGB DDR5 32GBx2 5200MHz
Display Card: AMD Radeon RX 7900 XTX
System Disk: Solidigm P41 Plus 1TB PCIe 4.0 SSD
Radiator: Wraith Prism (7900 / 7700), Wraith Stealth (7600), 360mm AIO Liquid Cooler (7950X / 7900X / 7700X / 7600X)
Power Supply: Seasonic PRIME PX-1000
Operating System: Windows 11 Pro 22H2
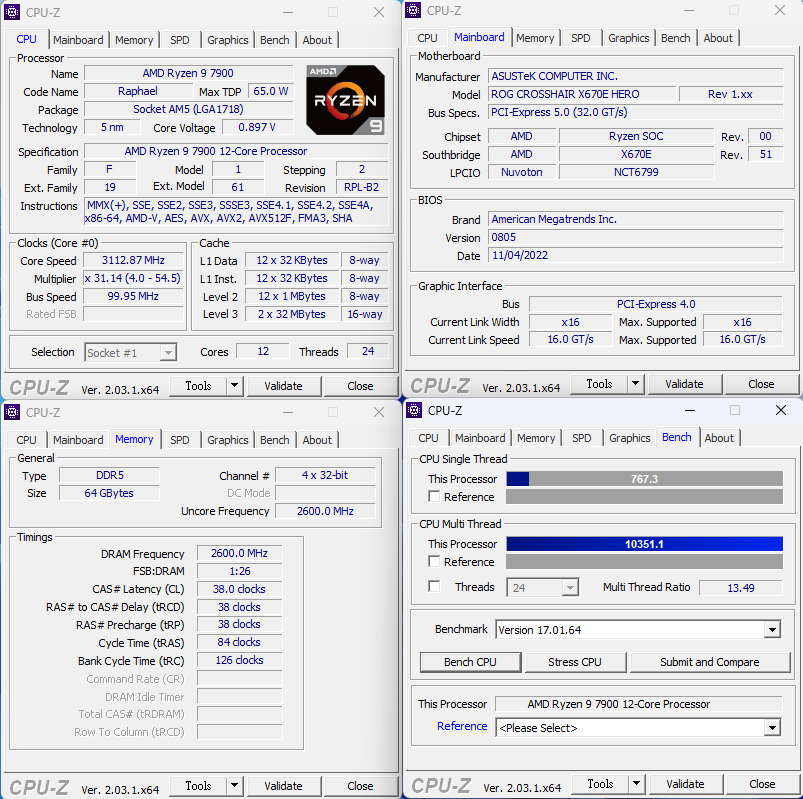
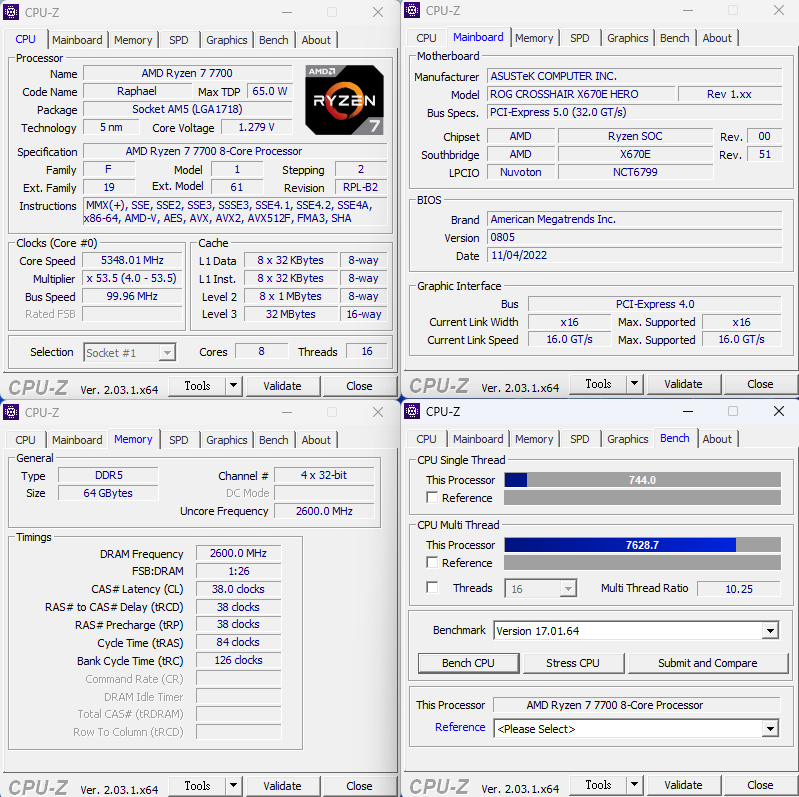
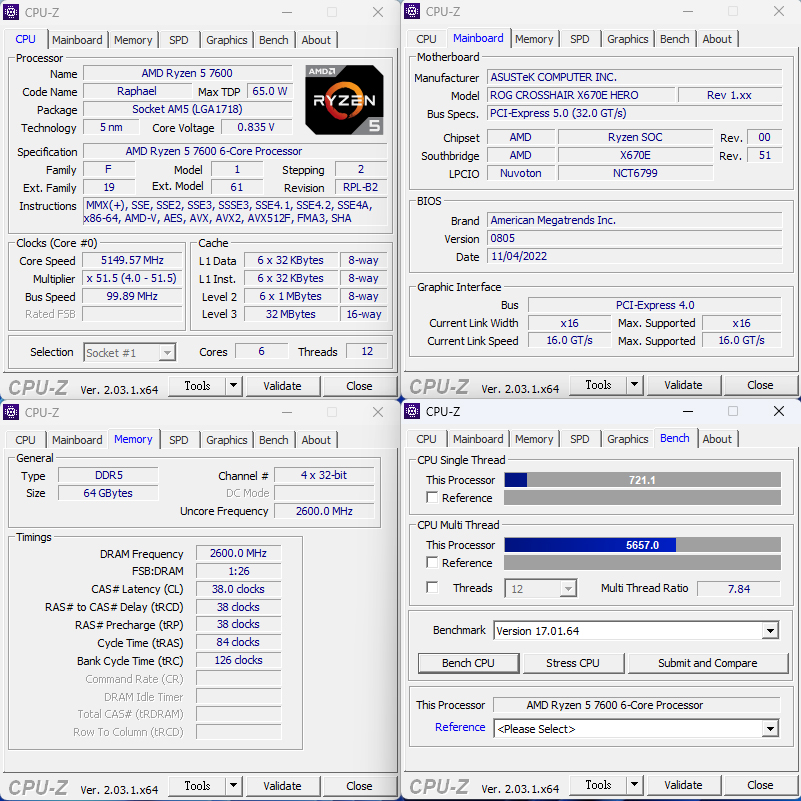
The correct processor information, including the code-name “Raphael,” 5nm process, and core and thread counts for the Ryzen 9 7900 (12C24T), Ryzen 7 7700 (8C16T), and Ryzen 5 7600 (6C12T), can be viewed using the CPU-Z software.
Processor Computing Performance Cinebench, VRay Rendering Test
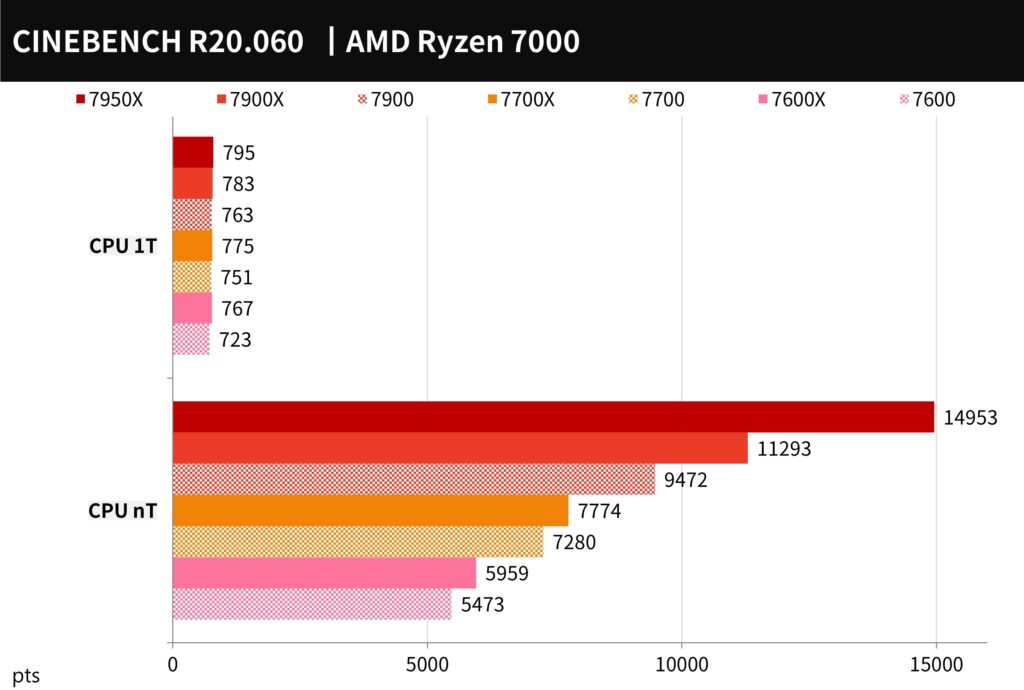
CINEBENCH R20 is a software developed by MAXON based on Cinema 4D that can be used to evaluate the 3D rendering performance of computer processors. It is a reliable test software that can quickly assess the multi-core computing performance of a CPU.
In the multi-threaded test, the 7900 scored 9472 points, the 7700 scored 7280 points, and the 7600 scored 5473 points. In the single-threaded test, the 7900 scored 763 points, the 7700 scored 751 points, and the 7600 scored 723 points.
Compared to the previous generation X series, the 7900 saw a decrease of 16% in multi-core performance and a 2.6% decrease in single-thread performance. The 7700 saw a decrease of 6.4% in multi-core performance and a 3.1% decrease in single-thread performance. The 7600 saw a decrease of 8.2% in multi-core performance and 5.7% in single-thread performance.
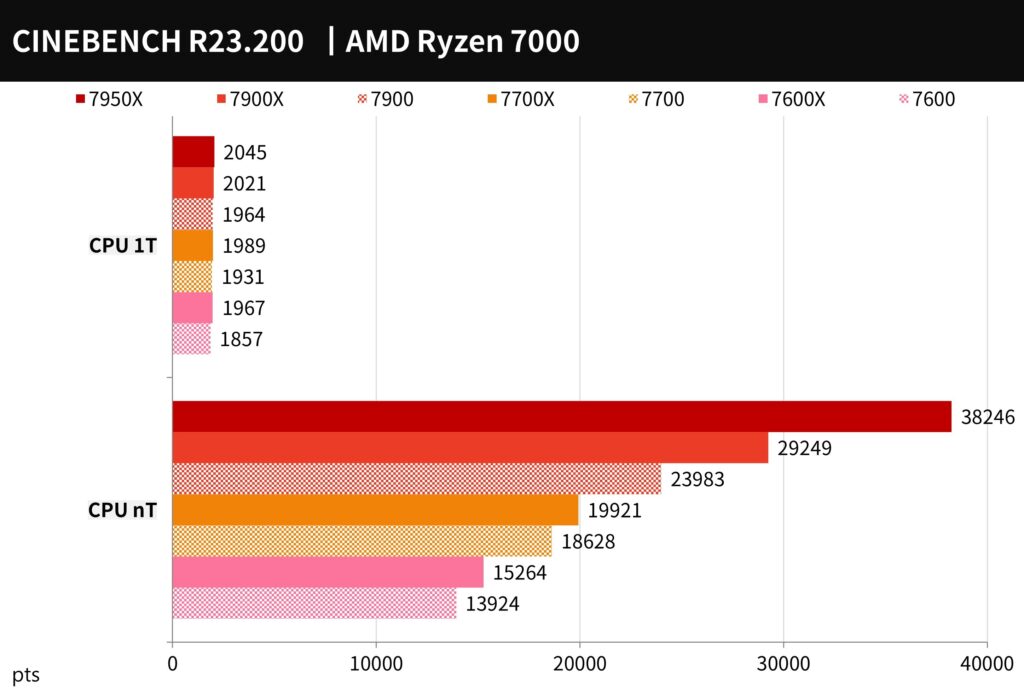
CINEBENCH R23 has the same test scenario as R20 but includes a new compiler and a stress test function. Players can customize the minimum test duration time, such as 10 or 30 minutes, to test the computer’s stability. However, the results from R23 cannot be compared to those from R20.
In the multi-threaded test, the 7900 scored 23983 points, the 7700 scored 18628 points, and the 7600 scored 13924 points. In the single-threaded test, the 7900 scored 1964 points, the 7700 scored 1931 points, and the 7600 scored 1857 points.
Compared to the previous generation X series, the 7900 saw a decrease of 18% in multi-core performance and a 2.8% decrease in single-thread performance. The 7700 saw a decrease of 6.5% in multi-core performance and a 2.9% decrease in single-thread performance. The 7600 saw a decrease of 8.8% in multi-core performance and a 5.6% decrease in single-thread performance.
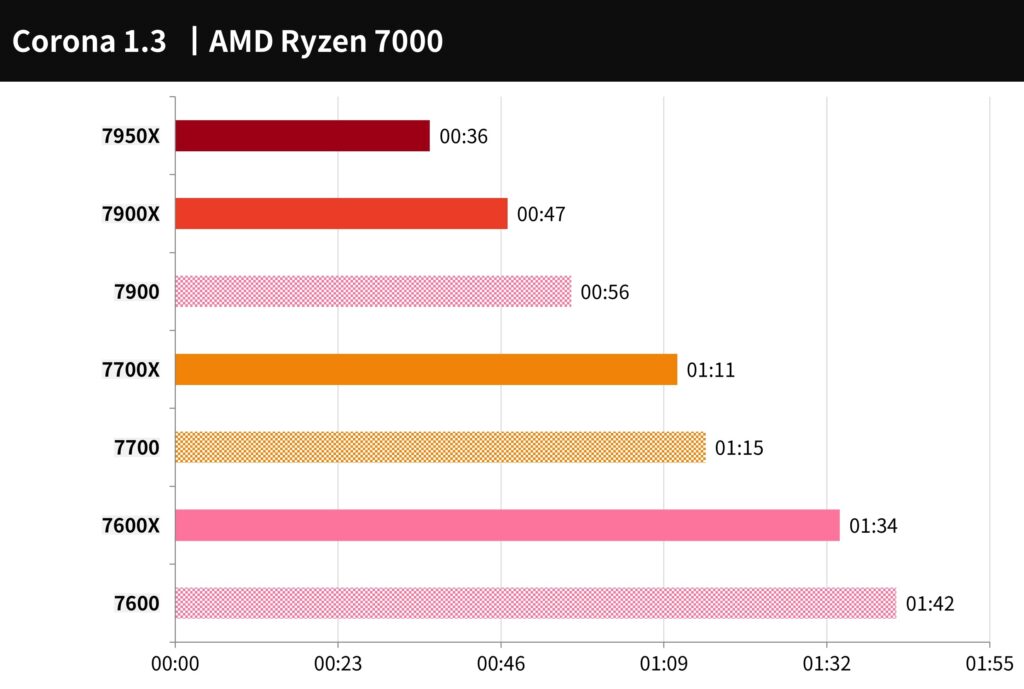
Corona Benchmark is a simple-to-use testing tool that uses the Corona Renderer 1.3 renderer to test the rendering speed of processors and measures performance in terms of rays per second. The tool scores the timing in seconds.
The 7900 takes 56 seconds to complete the calculation, the 7700 takes 1 minute and 15 seconds, and the 7600 takes 1 minute and 42 seconds. Compared to the previous generation X series, this represents a decrease in computing performance of 19.1% for the 7900, 5.6% for the 7700, and 8.5% for the 7600.
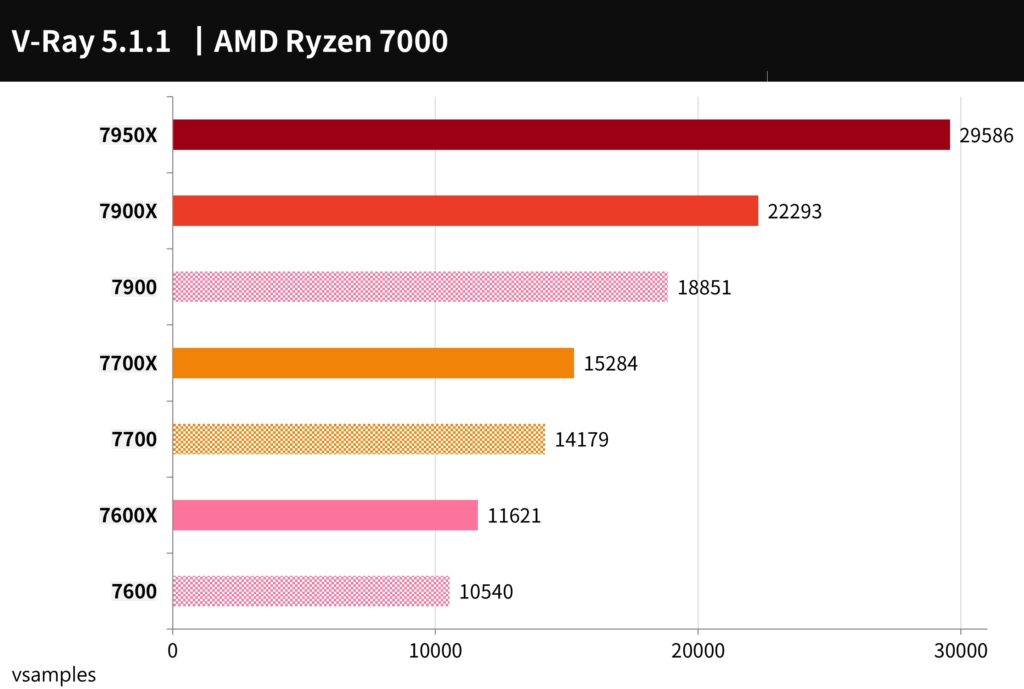
V-Ray Benchmark is a tool developed by Chaos Group. V-Ray is a ray rendering software based on physical laws and is used to test the computing performance of ray tracing on the CPU when rendering images. The CPU score is calculated in vsamples per second.
The 7900 scored 18851 points, which is -15.4% less performance than the 7900X; the 7700 scored 14179 points, which was -7.2% less performance than the 7700X; the 7600 scored 10540 points, which was -9.3% less performance than the 7600X.
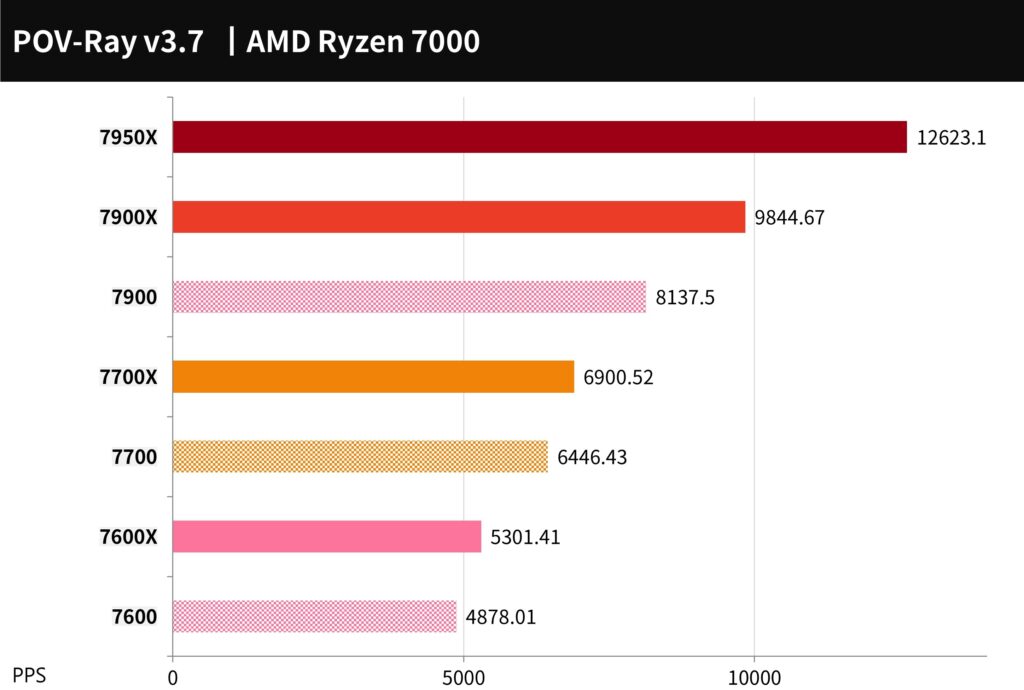
POV-Ray is a free ray tracing tool for 3D rendering that uses the multi-core power of a CPU to calculate the rendering of light, shadow, and 3D images.
The 7900 scored 8137.5 points, representing a 17.3% decrease in performance compared to the 7900X. The 7700 scored 6446.43 points, representing a 6.6% decrease in performance compared to the 7700X. The 7600 scored 4878 points, representing an 8% decrease in performance compared to the 7600X.
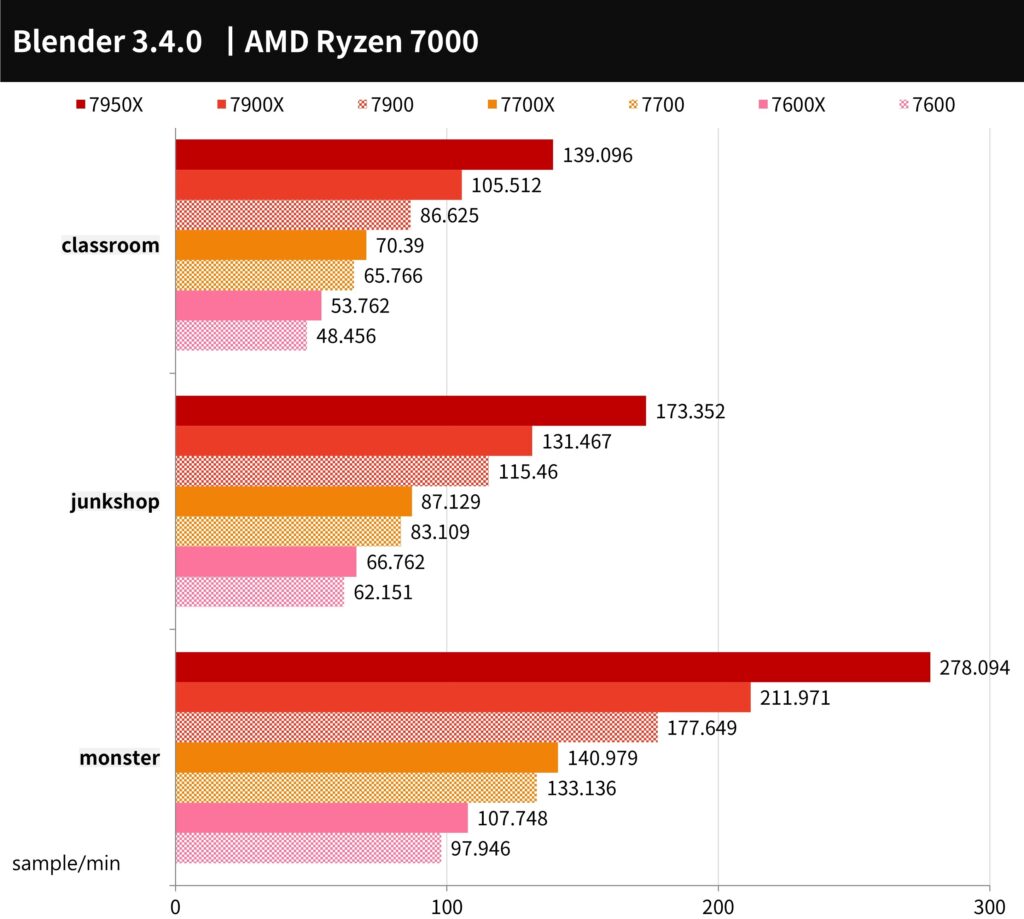
Blender is a cross-platform, open-source tool for creating 3D content that supports CPU and GPU acceleration for rendering and various 3D operations, including modelling, rigging, animation, simulation, rendering, compositing, and motion tracking.
In the Blender Benchmark 3.4.0 test using three scenarios: monster, junkshop, and classroom, the 7900 saw a 15.4% decrease in performance compared to the 7900X. The 7700 saw a 5.6% decrease in performance compared to the 7700X. The 7600 saw an 8.6% decrease in performance compared to the 7600X.
Create PR image output, LR and PS photo editing performance test
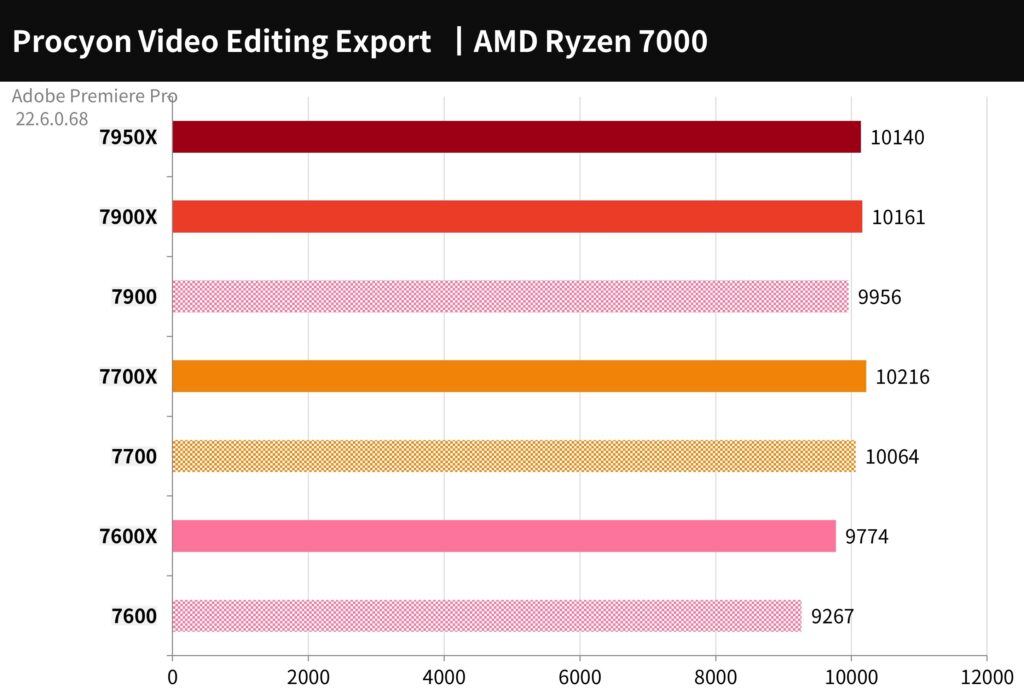
For the Adobe Premiere Pro 2020 conversion output test, the UL Procyon Video Editing Benchmark test tool was used to test the performance of outputting 2160p 30/60 FPS video as H.264 – YouTube 1080p Full HD and HEVC (H.265) – 4K UHD formats, both with and without GPU acceleration using an RX 7900 XTX graphics card.
If you only compare video output performance, the difference between CPUs is relatively small when using GPU acceleration. To see significant differences between CPUs, you need to test video effects that can only be calculated by the CPU or add test items such as audio and video editing and playback operations.
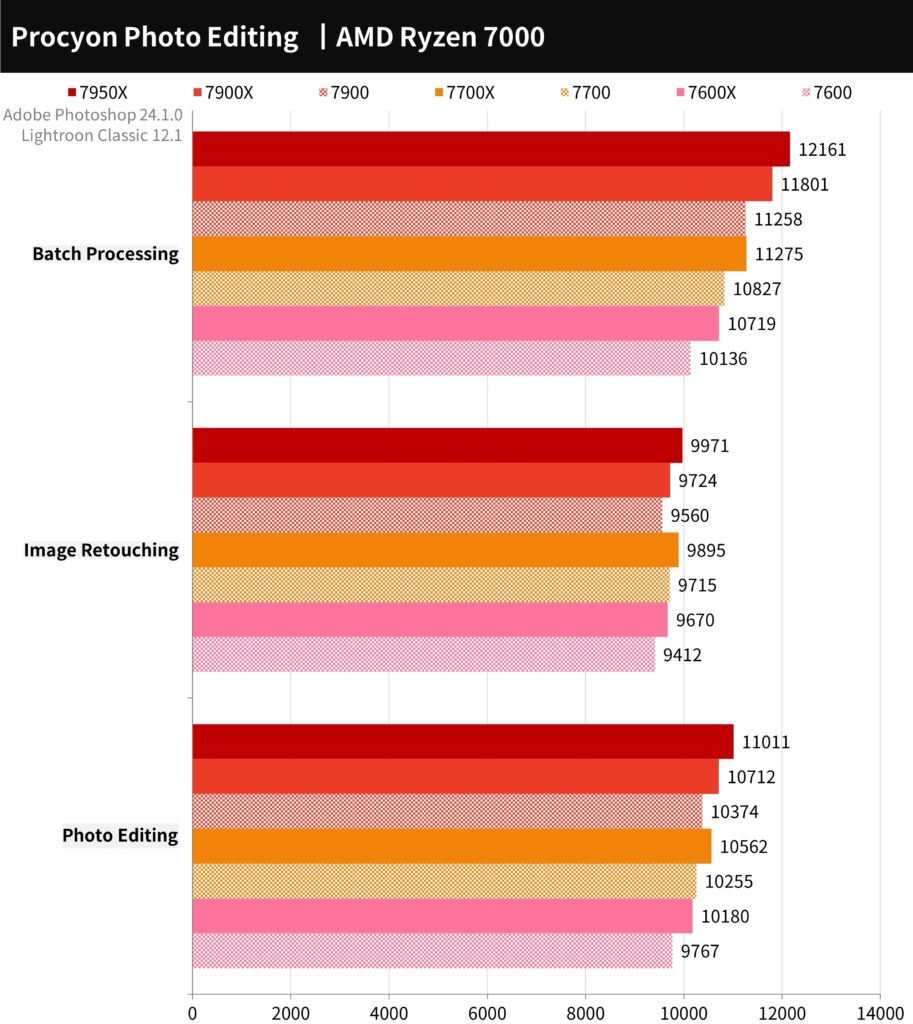
The UL Procyon Photo Editing Benchmark test tool was used to test Adobe Photoshop and Lightroom Classic. The Image Retouching test used Photoshop to perform photo editing and recorded the time for each step. The Batch Processing test used Lightroom to adjust and output many photos in a batch.
The 7900 scored 10374 points, the 7700 scored 10255 points, and the 7600 scored 9767 points. While modern mainstream CPUs can meet the performance needs for photo editing, the benefits of high-core processors become more apparent in batch processing.
AIDA64 processor memory, 7-Zip compression test
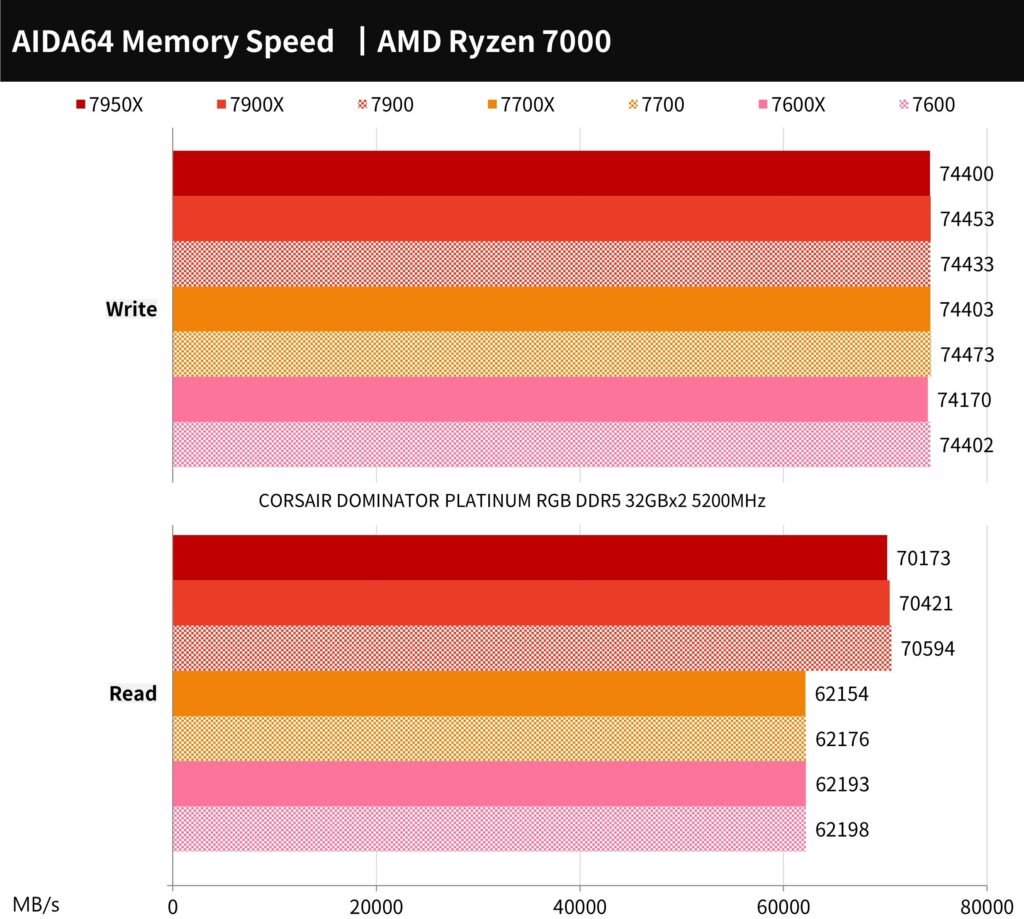
The memory test was conducted using AIDA64 and CORSAIR DOMINATOR PLATINUM RGB DDR5 32GB x 2 5200MHz memory. In the general writing test, the memory reached a speed of 74400 MB/s. In the reading test, the 7900 reached a speed of 70594 MB/s, while the 7700 and 7600 reached 62198 MB/s.
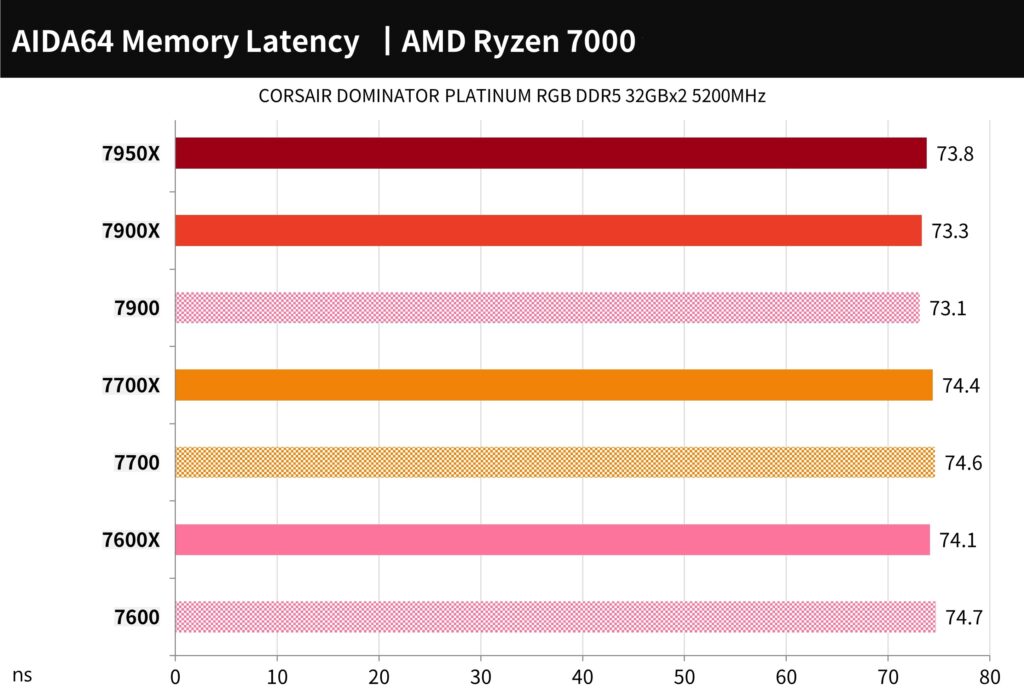
The memory latency was between 73.1ns and 74.7ns.
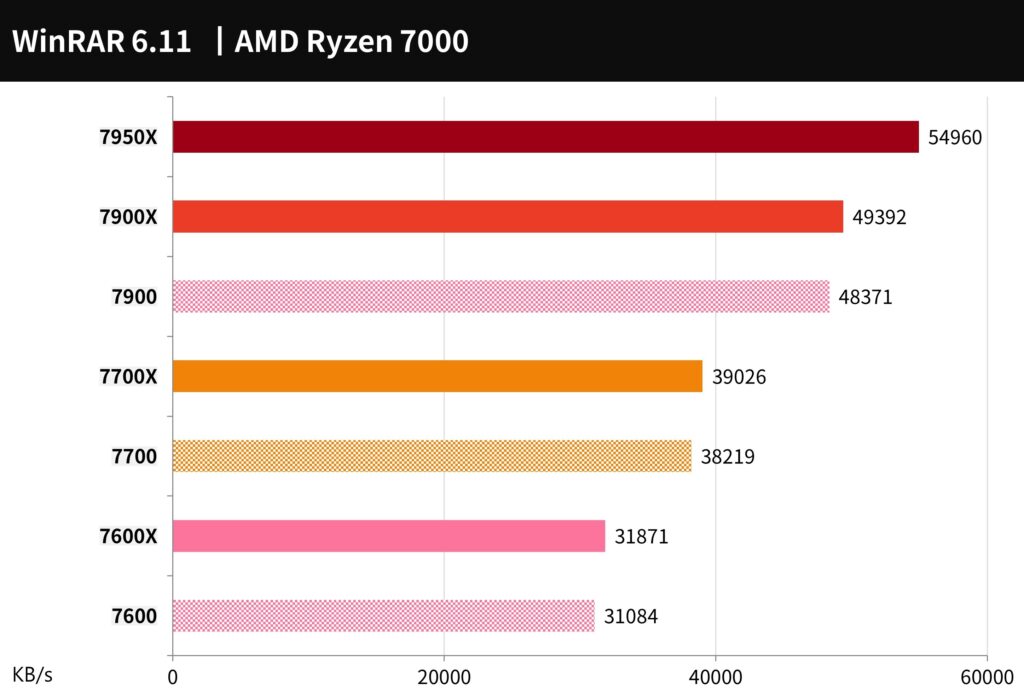
WinRAR is a commonly used compression tool. In terms of performance, the 7900 reached 48371 KB/s, the 7700 reached 38219 KB/s, and the 7600 reached 31084 KB/s.
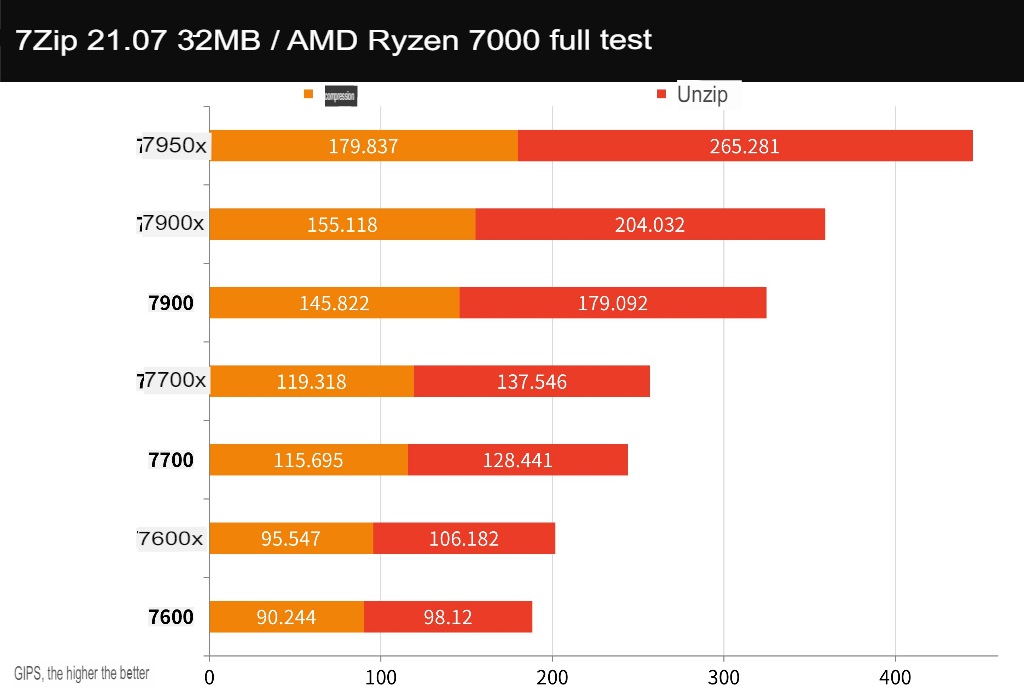
7-Zip is another well-known free compression tool that can effectively use multi-core performance, 7900 compressions 145.8 GIPS, decompression 179 GIPS; 7700 compression 115.6 GIPS, decompression 128.4 GIPS; 7600 compression 90.2 GIPS, decompression 98.1 GIPS.
PCMark 10, CrossMark and Office computer performance test
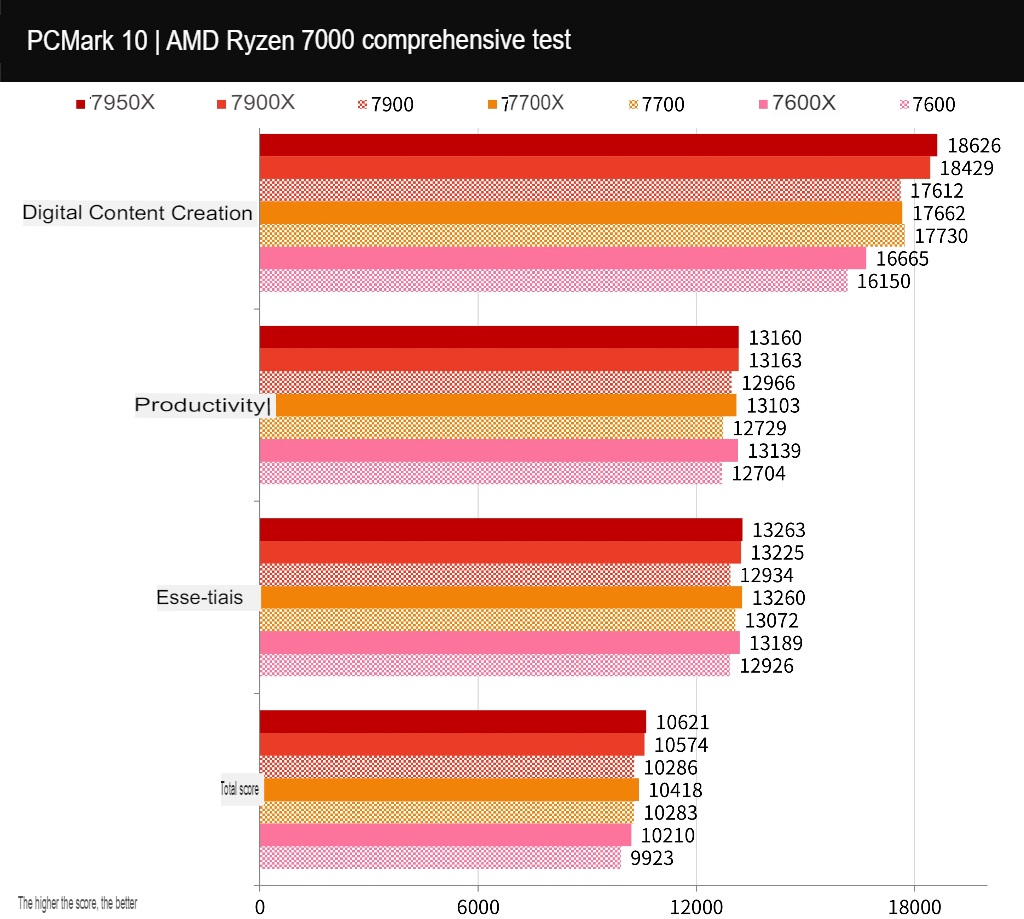
PCMark 10 was used to test the overall performance of the computer. It includes three tests: Essentials, Productivity, and Digital Content Creation. The Essentials test measures basic computer tasks such as app startup speed, video conferencing, and web browsing performance. The Productivity test measures performance with spreadsheet paperwork. The Digital Content Creation test measures photo/video editing, rendering, and visualization performance.
The 7900 scored 10286, the 7700 scored 10283, and the 7600 scored 9923. All of these scores are sufficient for basic document surfing and paperwork. Higher numbers of cores will result in more efficient digital content creation.
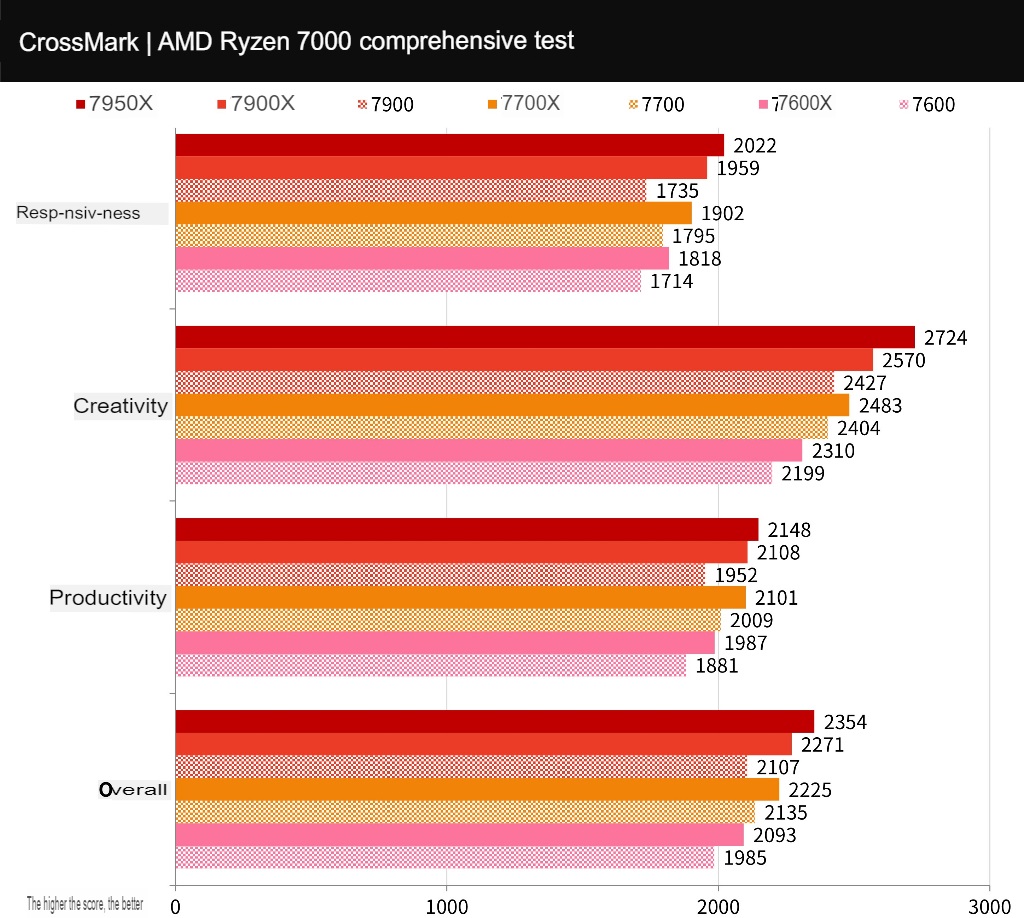
CrossMark is a free, cross-platform computer performance testing tool developed by BAPCo. It supports various platforms, including Windows, iOS/iPadOS, macOS, and Android. It is designed to test computer productivity tasks such as text editing, spreadsheets, and web browsing and creative tasks such as photo editing, organizing, and video editing. It also tests the response speed of a computer.
The 7900 scored 2107 points, the 7700 scored 2135 points, and the 7600 scored 1985 points. This test included a computer response time test item, so a higher CPU clock rate significantly improves overall performance.
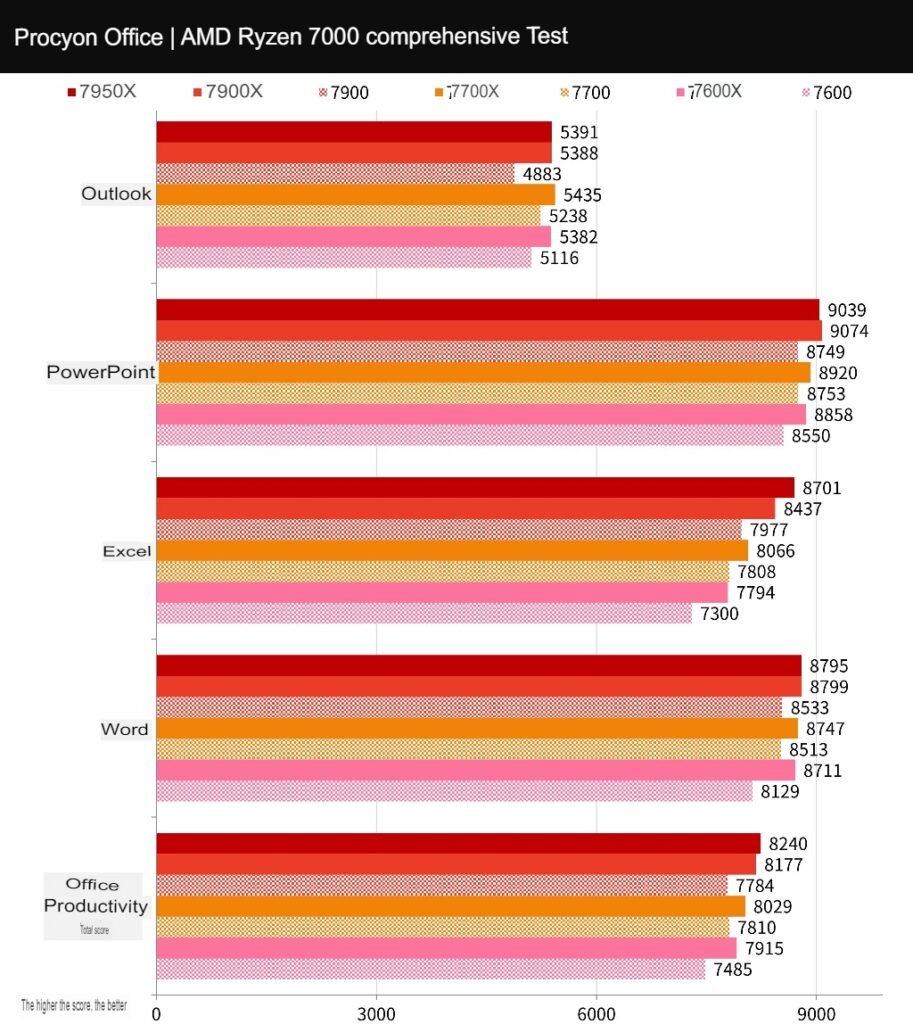
The UL Procyon Office Productivity Benchmark Test uses Microsoft Word, Excel, PowerPoint, and Outlook to test Windows computers’ practical and real performance in daily work. It uses common paperwork tasks to design test scenarios, including opening documents, copying, inputting data, trial calculations, sorting tables, and exporting. It also tests adding files, graphics, videos, and emails to presentations.
The 7900 scored 7784 points, the 7700 scored 7810 points, and the 7600 scored 7485 points. There is no significant difference in performance for general paperwork tasks, but CPUs with higher clock speeds also have higher scores.
3DMark CPU Performance and FS, TS Benchmark Test
The computer graphics game performance test tool 3DMark includes two tests: the mainstream Direct X11 test, Fire Strike and the Direct X12 Time Spy test.
In the Fire Strike Physics project, the score is higher for CPUs with higher clock speeds. However, the total score for the 7900 is relatively higher than that of the 7700 and 7700X. This suggests no significant advantage to using more than 8 cores in DX11. As for the DX12 Time Spy test, the results are in line with expectations, showing that there is little difference in game performance among CPUs, but high-end CPUs will have better performance.
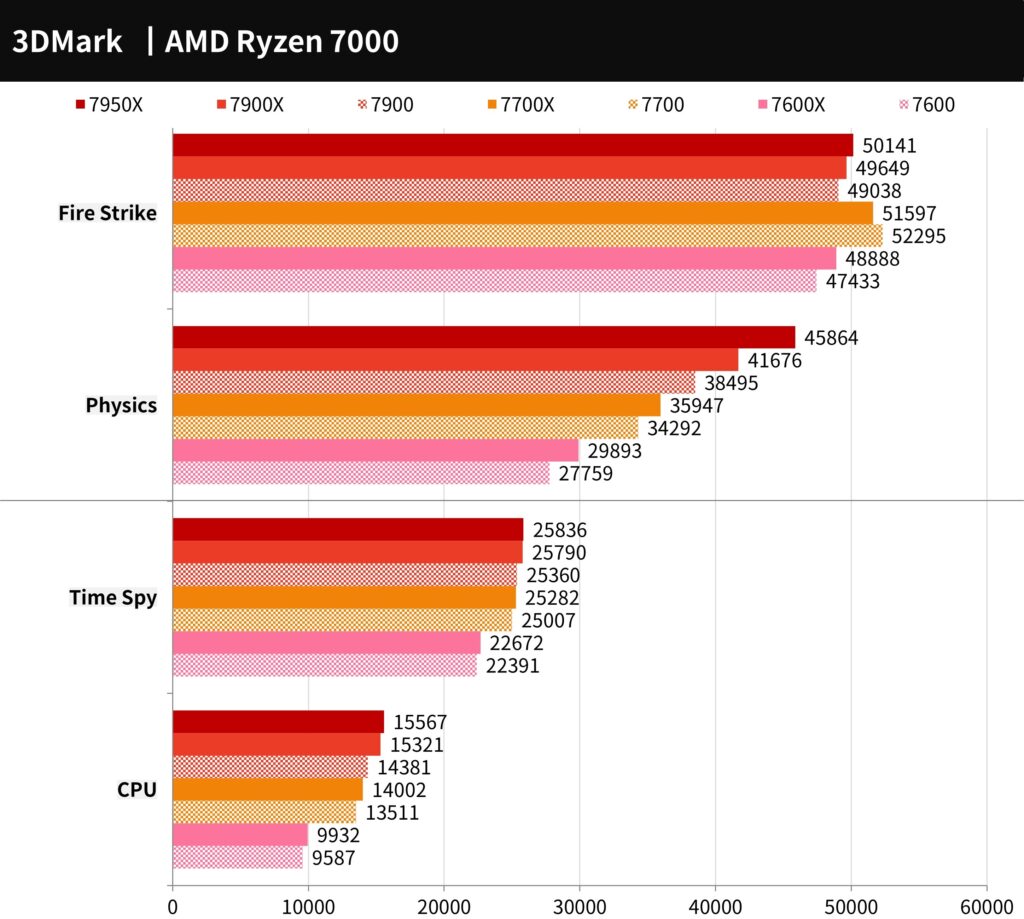
The 3DMark CPU test measures the CPU’s physical operation and custom simulation, testing its performance with 1, 2, 4, 8, 16 and the maximum number of execution threads. Performance above 16 execution threads is used for 3D rendering, audio and video output. Generally, DX12 games prefer 8 execution threads, while older games may have different preferences.
The performance of processors in the 1T-4 T-tests is relatively similar, but the performance gap increases at 8T. The performance of processors above the 7900 can be seen at 16T and above.
9+2 AAA e-sports games for processor performance test
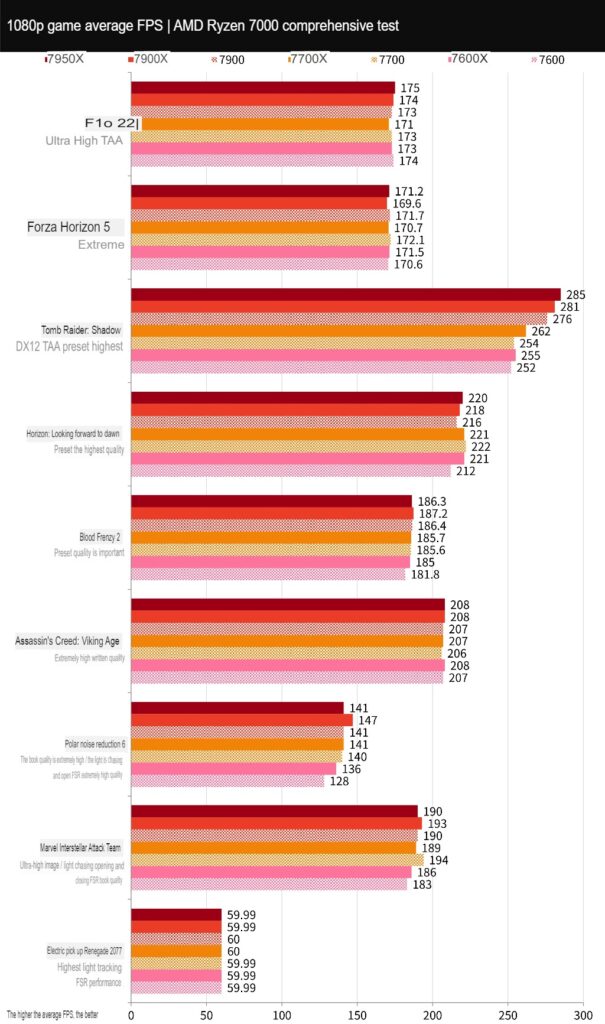
There are nine AAA game performance tests, including entry-level games “F1® 22” and “Forza Horizon 5,” adventure games “Tomb Raider: Shadow” and “Horizon: Waiting for Dawn,” and performance-intensive games “Blood Killing 2” and “Assassin’s Creed: Viking Era.” There are also lighter games such as “Polar Trench 6,” “Marvel Interstellar Attack Team,” and “Dian Yu,” as well as “Cyberpunk 2077.
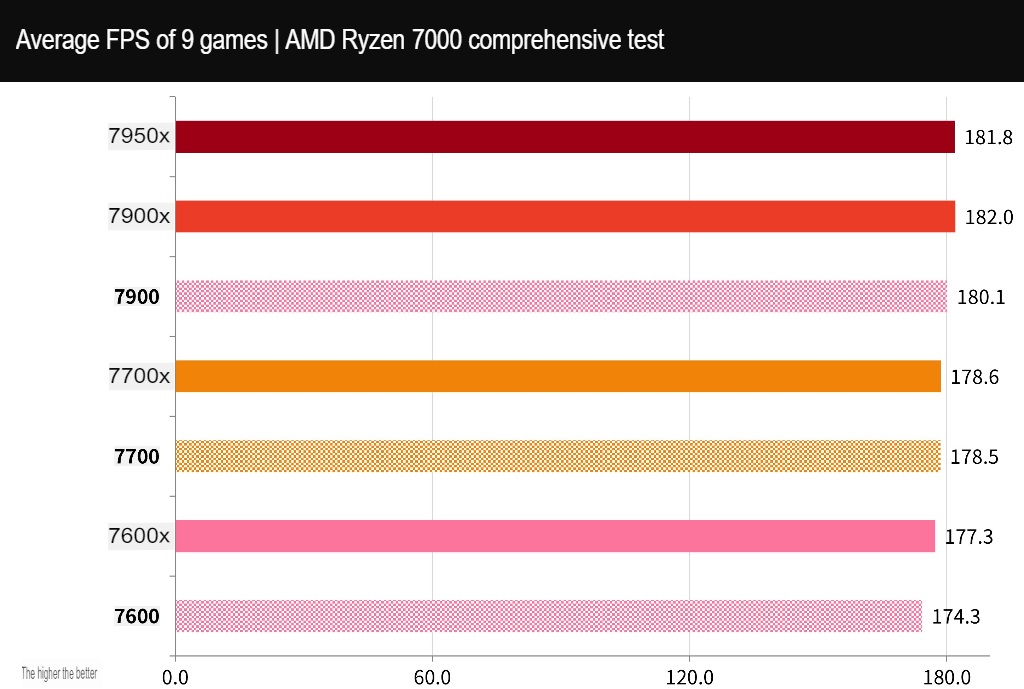
All tests were run using the In-Game Benchmark test at 1080p resolution with the highest default settings for the game.
Out of the nine games tested, the 7900 achieved an average of 180.1 FPS, the 7700 achieved an average of 178.5 FPS, and the 7600 achieved an average of 174.3 FPS. The difference in game performance between the three processors was only about 1%.
E-sports games prioritize tactical and technical competition between players and teams rather than high requirements for game graphics. This allows for high average FPS performance on high-end CPUs and GPUs, especially at 1080p resolution. Increasing CPU performance and clock speed in fast-paced games can improve FPS performance.
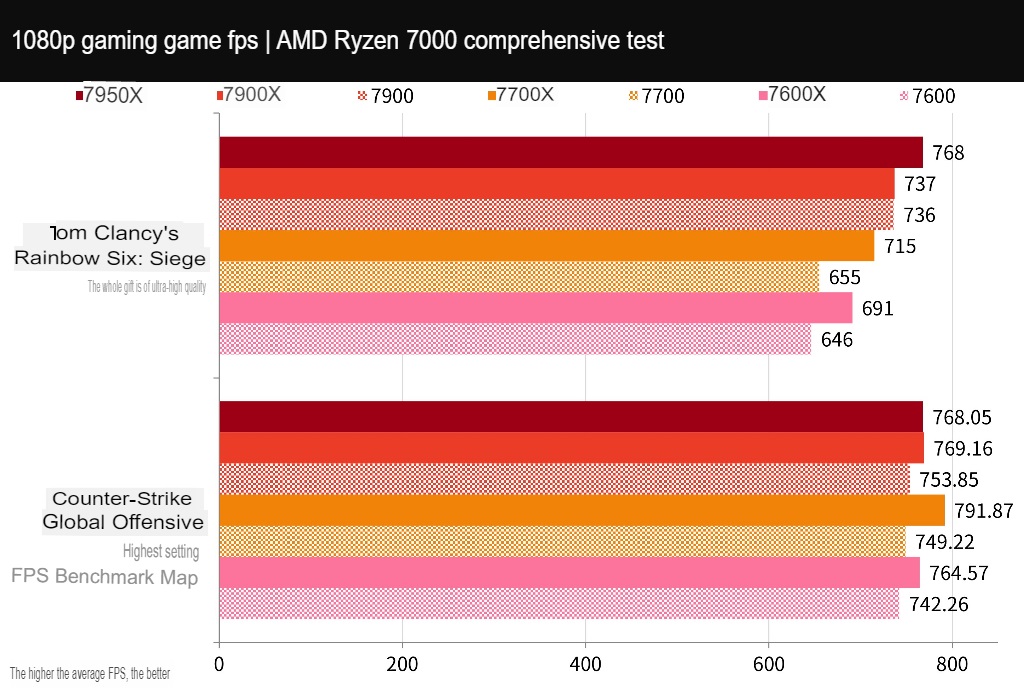
The test used two games, “Counter-Strike: Global Offensive” (CS: GO) and “Tom Clancy’s Rainbow Six: Siege” (R6), at 1080p resolution and the highest settings.
In the CS:GO game, the 7900 had 753.85 FPS, the 7700 had 749.22 FPS, and the 7600 had 742.26 FPS. In the R6 game, the 7900 had 736 FPS, the 7700 had 655 FPS, and the 7600 had 646 FPS. For e-sports games, the difference in performance due to high CPU clock speed is more noticeable.
Ryzen 7900, 7700, and 7600 processor temperature and power consumption test
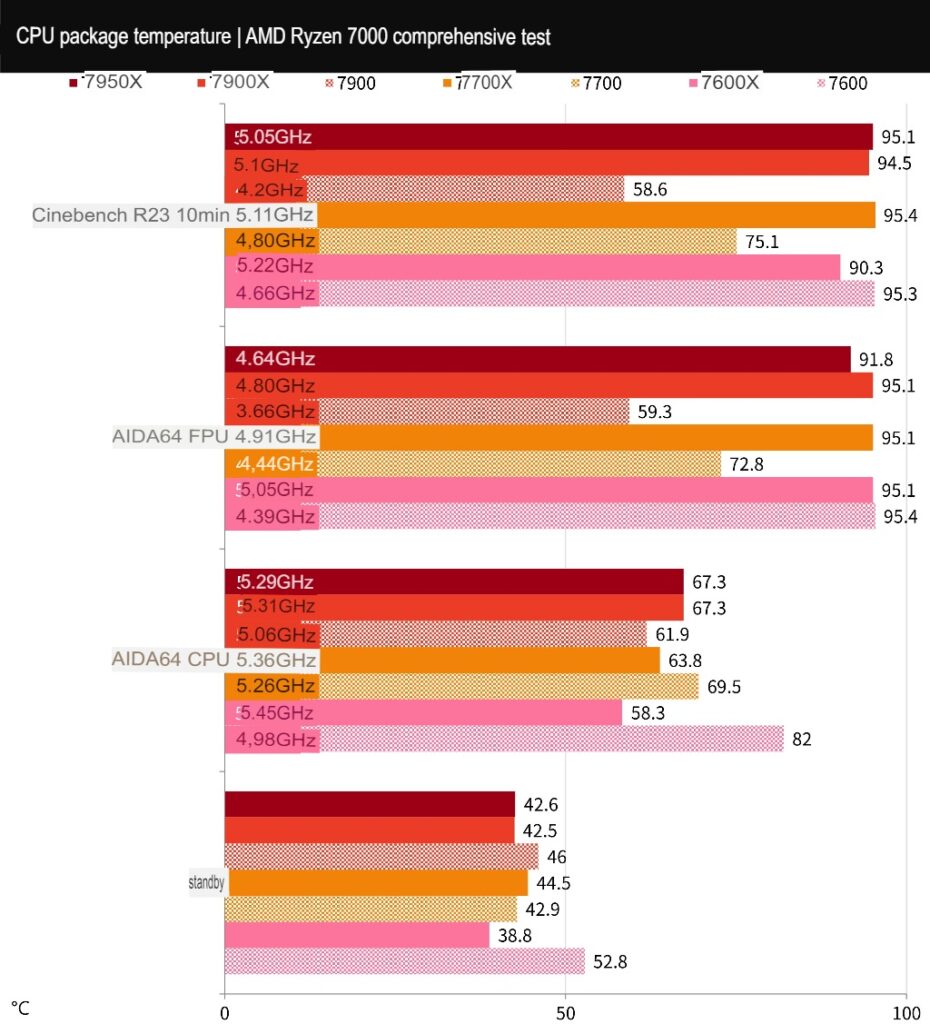
The stress test results for the Ryzen 7900, 7700, and 7600 processors show that they use original radiators, while the X series uses a 360mm AIO system with the fan and water pump running at full speed. The temperature during general computer use is similar to the AIDA64 CPU test, while the FPU test generates higher heat and power consumption levels.
During the AIDA64 CPU stress test, the 7900 processor reaches a temperature of 61.9°C while running at a frequency of 5.06 GHz, the 7700 processor reaches a temperature of 69.5°C while running at a frequency of 5.26 GHz, and the 7600 processor reaches a temperature of 82°C while running at a frequency of 4.98 GHz. In the FPU stress test, the 7900 processor reaches a temperature of 59.3°C while running at a frequency of 3.66 GHz, the 7700 processor reaches a temperature of 72.8°C while running at a frequency of 4.44 GHz, and the 7600 processor reaches a temperature of 95°C while running at a frequency of 4.39 GHz.
The temperature during the Cinebench R23 stress test is similar to that of the FPU test. The results show that the AMD Wraith Prism RGB radiator performs well in cooling the 7900 and 7700 processors, allowing them to run at their full basic Boost performance. However, the Wraith Stealth cooler of the 7600 processor is not sufficient for cooling.
In summary, the 7900, 7700, and 7600 processors can meet their Boost performance requirements with their original radiators. Still, it is recommended to use a tower fan or water-cooled radiator for PBO overclocking.
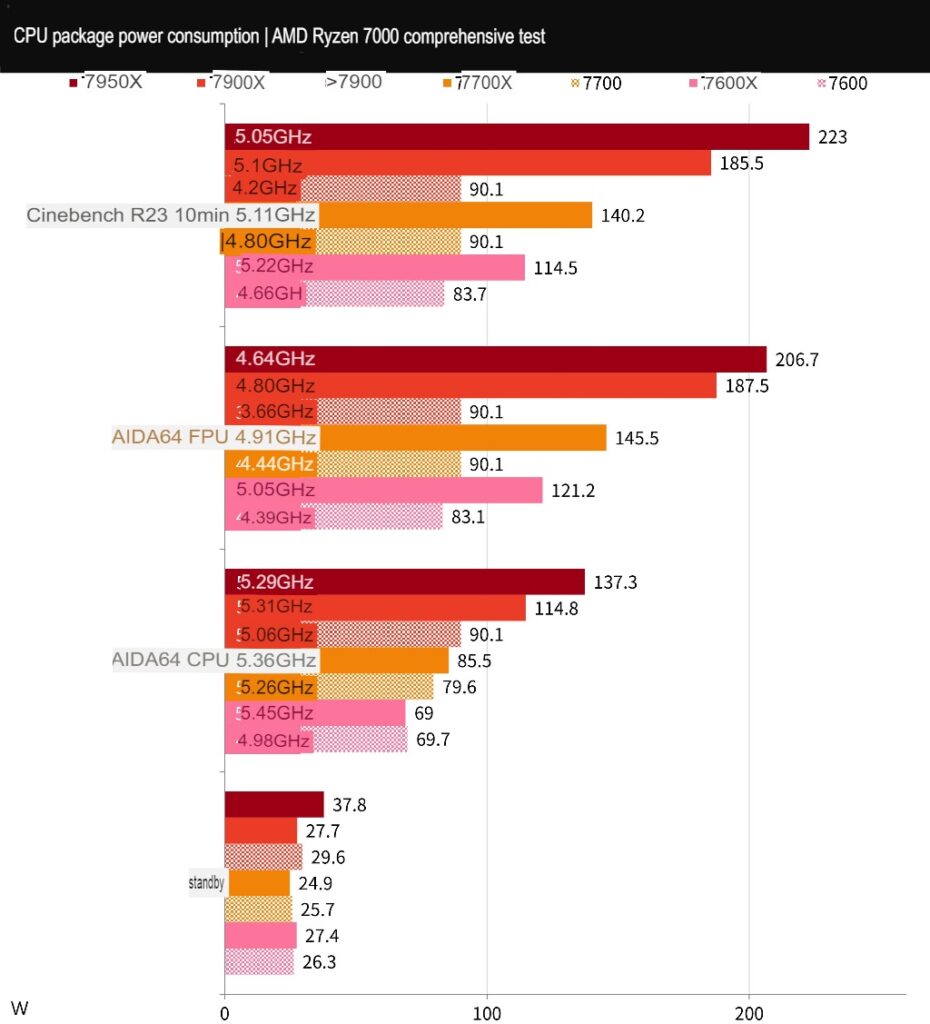
The power consumption of the processors is mainly determined by the CPU Package Power. During the AIDA64 CPU test, the 7900 processor consumes 90.1W, the 7700 processor consumes 79.6W, and the 7600 processor consumes 69W. In the FPU test, the 7900 and 7700 processors consume 90.1W, while the 7600 processor consumes 83.1W.
In other words, the 7900, 7700, and 7600 processors have a default maximum power consumption of around 90W unless the user enables PBO or manually overclocks to exceed the preset power consumption limit.
Ryzen 7900, 7700, and 7600 overclocking with water cooling and PBO
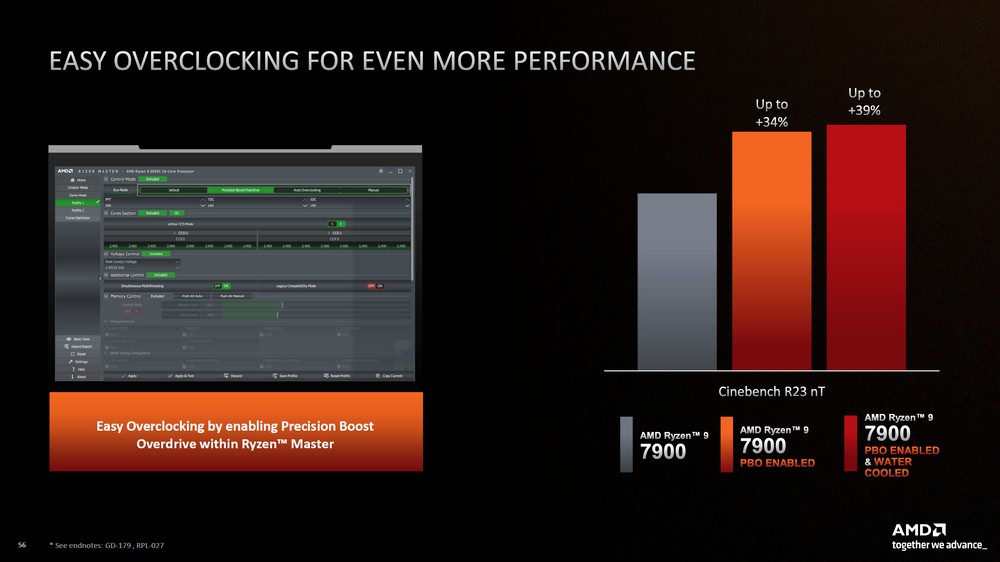
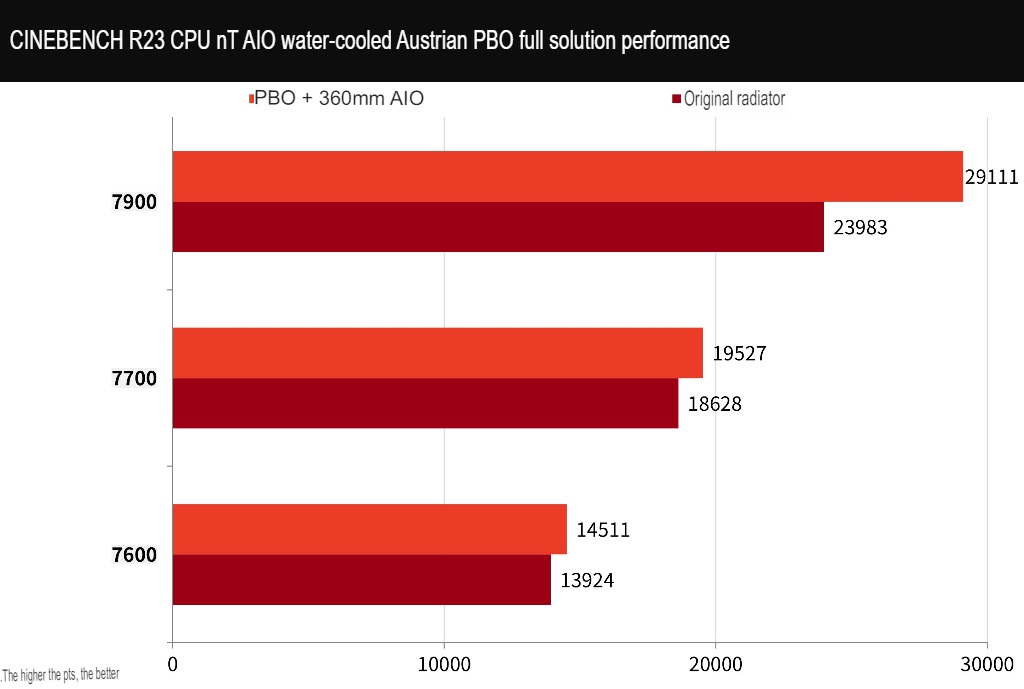
If the budget allows, players can upgrade the radiator of the 7900, 7700, and 7600 processors to unlock PBO overclocking and improve performance. In the test, after using 360mm AIO water cooling to enable PBO overclocking on the 7900 processor, the Cinebench R23 CPU score increased by about 21% to 29111 points.
Enabling PBO overclocking mainly improves multi-core performance. The overall computer performance and single-core performance see relatively small improvements. After turning on PBO, the 7700 processor’s multi-core performance improves by 5%, and the 7600 processor’s multi-core performance improves by 4%. In other words, choosing the 7900 processor and enabling PBO provides the most cost-effective performance improvement.
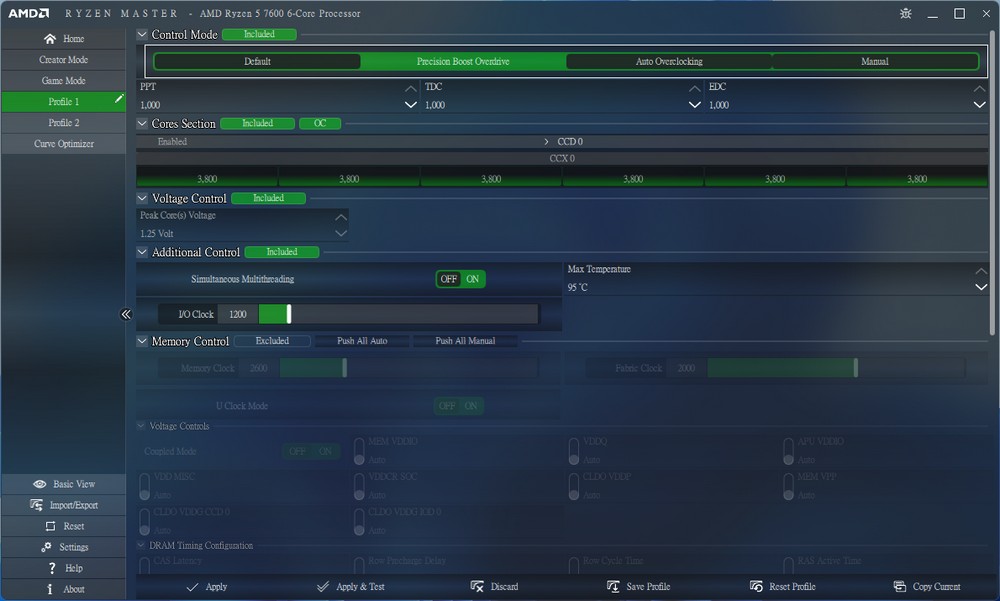
Players can easily enable PBO overclocking through the BIOS or Ryzen Master. Even entry-level processors from AMD provide the option to overclock the CPU and DRAM.
Summarize
AMD has released the Ryzen 7000 65W processor, a cost-effective option for entry-level and mainstream players, in addition to the 7900, 7700, and 7600 processors. While its performance may be slightly weaker than the X series, the original fan is sufficient for basic performance requirements. For PBO or manual overclocking, it is recommended to use a better air-cooled or water-cooled radiator.
In the future, players can look forward to the release of the Ryzen 7000X3D processor in February, which will improve game performance by adding a 3D Cache. With this release, we will see if AMD can reclaim the title of the strongest game processor.
If this article is helpful for you, please share this article with your friends on social media. Thank you!
This article is based on the personality of the reviews. You are responsible for fact-checking if the contents are not facts or accurate.
Title: A report on the performance of AMD processors, including the Ryzen 7900, 7700, and 7600, under a 65-watt cooling configuration with the new “force standard” configuration