While the gaming performance might not be on par with the Ryzen 7950X3D, the Ryzen 7 7800X3D offers exceptional gaming value for the price, making it the go-to choice for the ultimate gaming processor. The AMD Ryzen 7 7800X3D processor features a massive 96MB L3 3D V-Cache, boosting 1080p gaming performance by 15.7%. However, the stacked cache on the core results in a marginally lower clock rate and a slight decrease in multi-core performance. Nonetheless, this trade-off delivers enhanced gaming and power efficiency.
AMD 3D V-Cache Best Budget Gaming Processor Ryzen 7 7800X3D
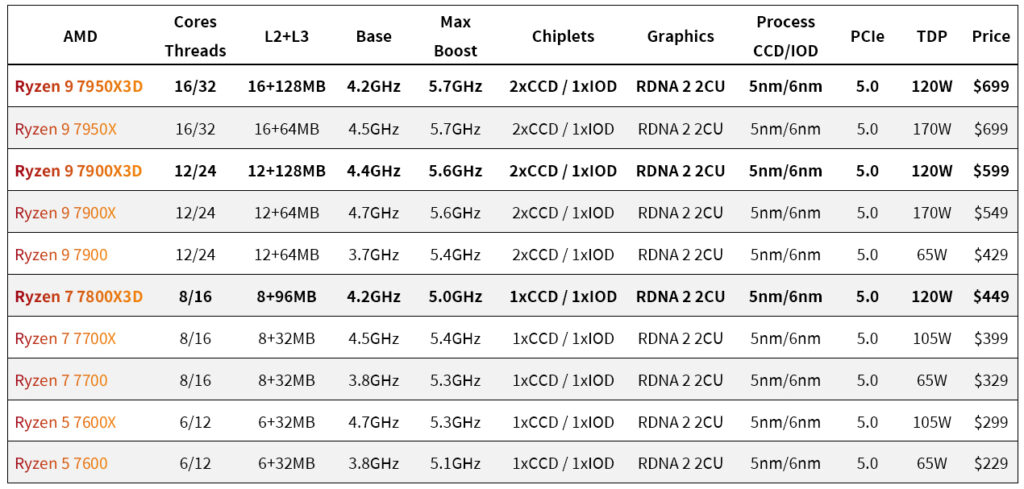
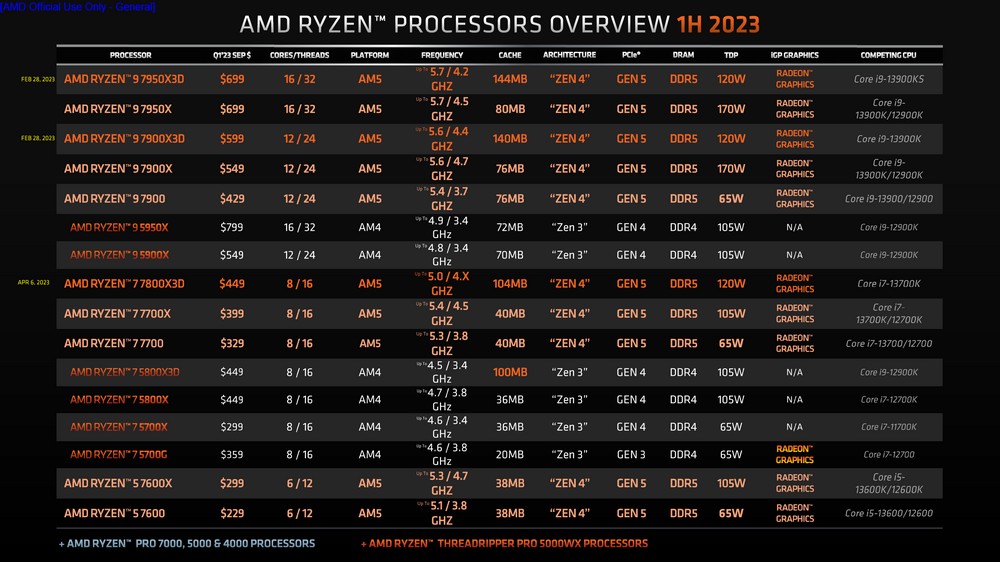
Not long ago, AMD launched the high-core 3D V-Cache processors, Ryzen 7950X3D and 7900X3D. Now, they’ve introduced the 8-core Ryzen 7 7800X3D. The processor utilizes “3D V-Cache” packaging technology, stacking 64MB L3 chips onto the core chip CCX to boost 1080p gaming performance.
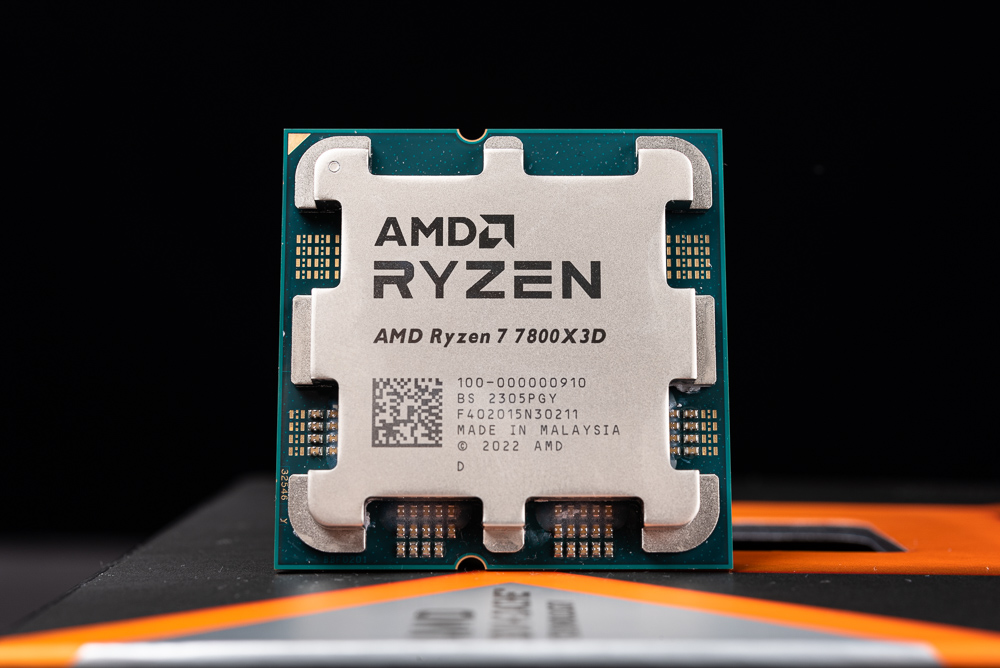
The Ryzen 7 7800X3D features 8 cores, 16 execution threads, a maximum Boost clock speed of 5.0GHz, and a TDP increase to 120W. It is priced at $449 USD. When compared to the 7700X with identical core specifications, the main difference is a lower clock frequency and increased TDP, but the price is also $50 higher. However, the 7800X3D’s TjMax is set at a maximum of 89°C, lower than the typical 95°C for X processors.
The 7800X3D processor is slated for release at 9:00 p.m. on April 6. The price in Taiwan is expected to be between that of the 7700X and 7900X. However, if the price is too steep, it may deter 1080p gamers from purchasing it.
Windows Game Mode, 3D V-Cache optimization and PPM exclusive driver update
For the Ryzen 7950X3D and 7900X3D, which feature two independent CCX configurations, it’s crucial to install the latest chipset driver and enable the Windows-default Game Mode. This ensures that games prioritize the CCX with 3D V-Cache for optimal performance.
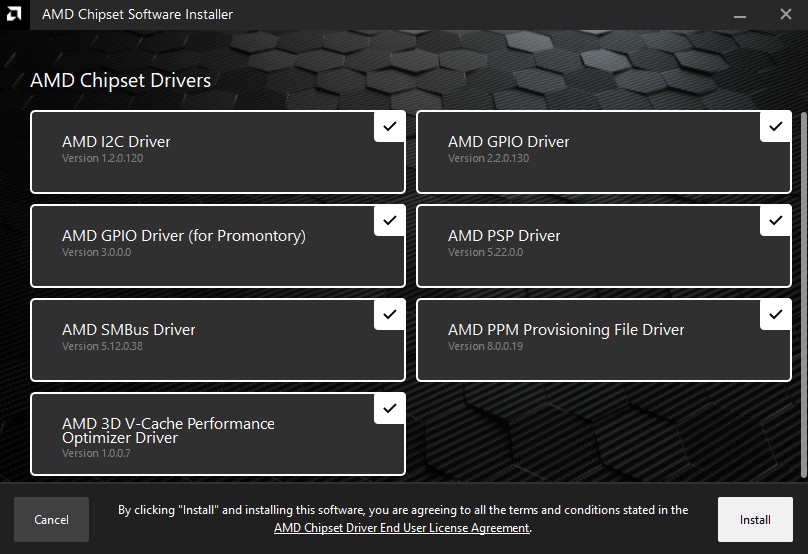
However, with the 7800X3D’s single CCX configuration, there is no need for additional core scheduling through the system and drivers. When the chipset driver is installed, the AMD PPM Provisioning File Driver and AMD 3D-Vacche Performance Optimizer Driver functions will be included. As a result, when purchasing a Ryzen 7000X3D processor, users should not only upgrade their motherboard BIOS but also install the latest chipset drivers to fully harness the processor’s performance.
Test platform and settings
This evaluation primarily concentrates on the gaming performance of the AMD Ryzen 7 7800X3D, comparing it to the Intel Core i9-13900K and AMD Ryzen 9 7950X, as well as the 7700X processors. A consistent AIO 360mm water-cooling radiator is used for cooling, and the motherboard’s preset Auto setting is employed to unlock the power consumption limit, while DDR5-6000 EXPO memory is utilized. The following test platform is provided for your reference.
Test Platform
Processor: AMD Ryzen 9 7950X3D / 7800X3D / 7700X, Intel Core i9-13900K
Motherboard: ROG CROSSHAIR X670E HERO, ASRock Z790 Taichi
Memory: G.SKILL TRIDENT Z5 NEO DDR5-6000 16GBx2
Graphics Card: NVIDIA GeForce RTX 4090
System Drive: Solidigm P41 Plus 1TB PCIe 4.0 SSD
Radiator: 360mm AIO Liquid Cooler
Power Supply: Seasonic PRIME PX-1000
Operating System: Windows 11 Pro 22H2
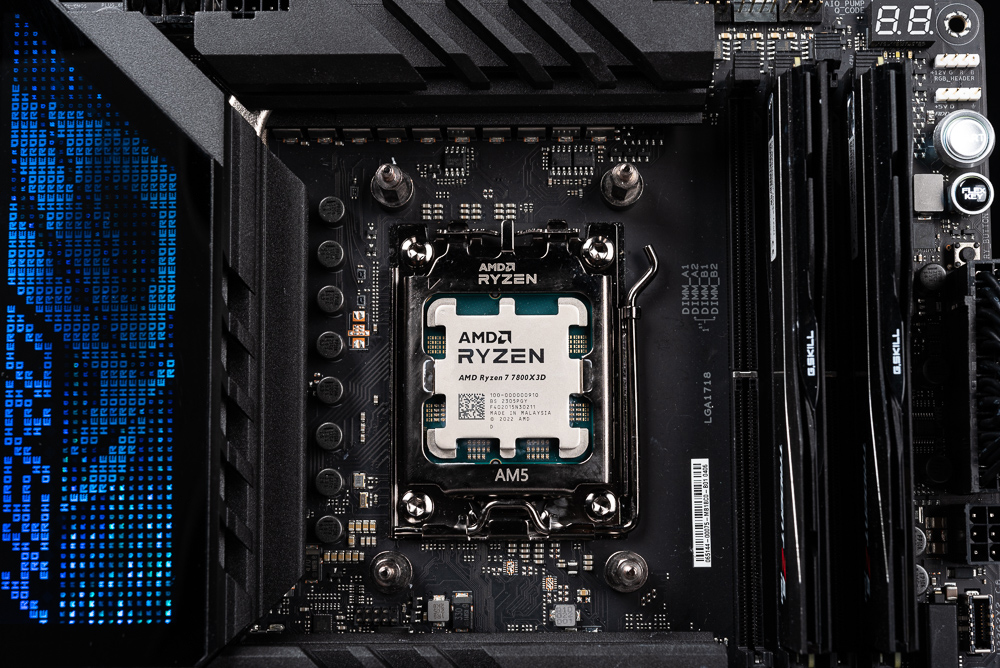
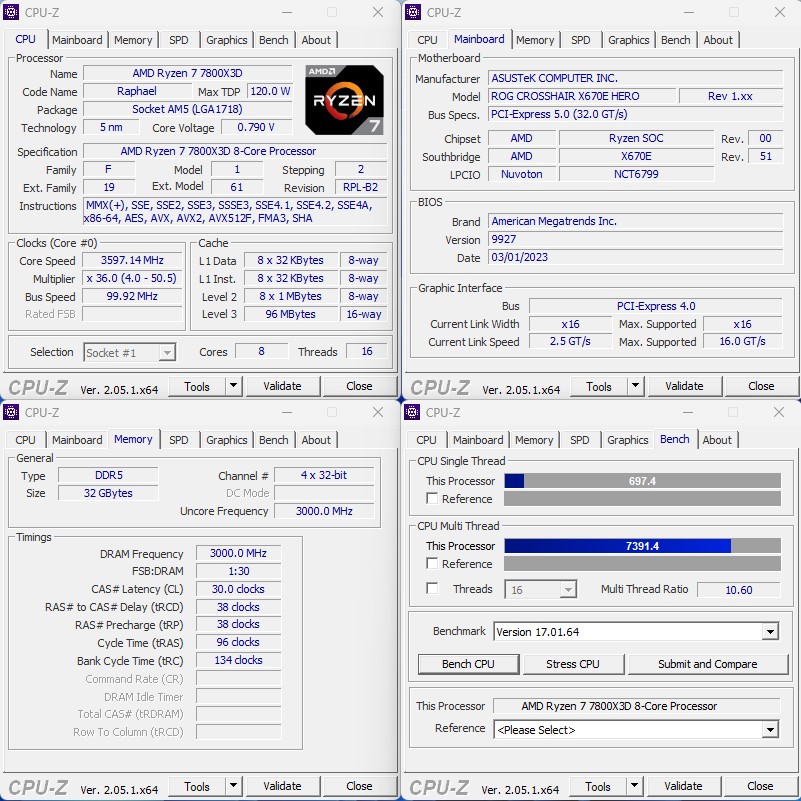
CPU-Z inspects the AMD Ryzen 7 7800X3D processor details, which is codenamed Raphael, built using a 5nm process, and has a TDP of 120W. It features 8 cores and 16 execution threads. The tested motherboard is the ROG CROSSHAIR X670E HERO, and the memory configuration consists of DDR6 6000 16GBx2.
Processor Computing Performance Cinebench, VRay Rendering Test
CINEBENCH R20, created by MAXON and based on Cinema 4D, is a benchmarking tool designed to assess the 3D rendering performance of computer processors. It serves as a dependable testing software that can swiftly evaluate a CPU’s multi-core processing capabilities.
In the multi-threaded test, the 7800X3D scores 7080 points, and in the single-threaded test, it achieves 704 points. When compared to the 7700X, the multi-core performance is reduced by 6.6%, and the single-thread performance sees a decrease of 9.2%.

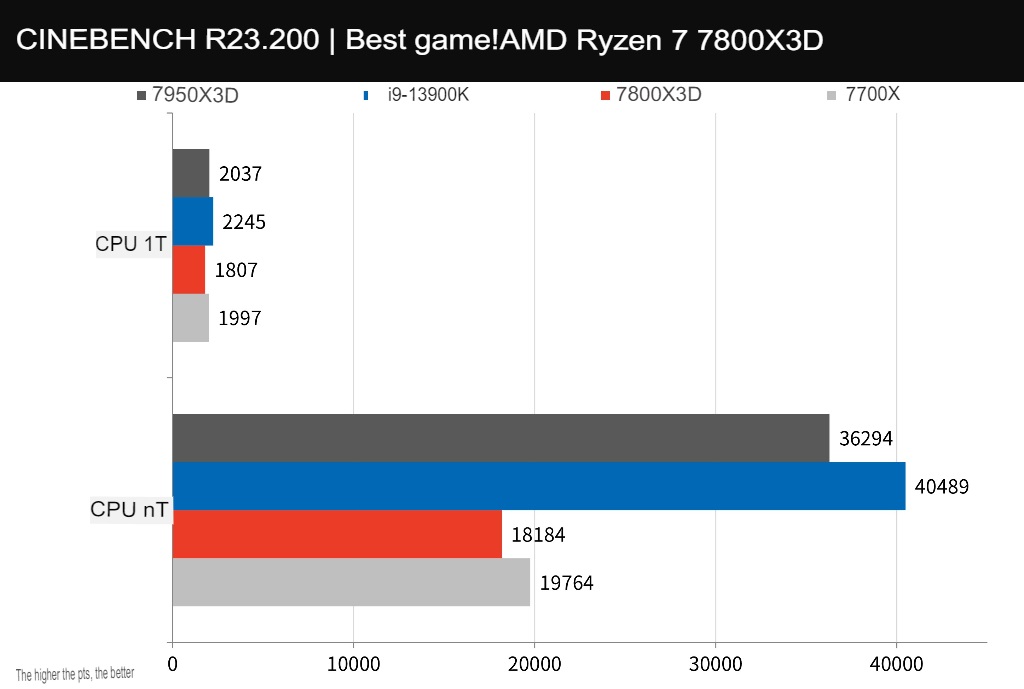
CINEBENCH R23 shares the same testing scenario as R20 but introduces a new compiler and a stress test function. Users can customize the Minimum Test Duration time, such as 10 or 30 minutes, to evaluate their computer’s stability. However, R23 results cannot be directly compared to R20.
In the multi-threaded test, the 7800X3D scores 18184 points, and in the single-threaded test, it achieves 1807 points. When compared to the 7700X, the multi-core performance is reduced by 8%, and the single-thread performance sees a decrease of 9.5%.
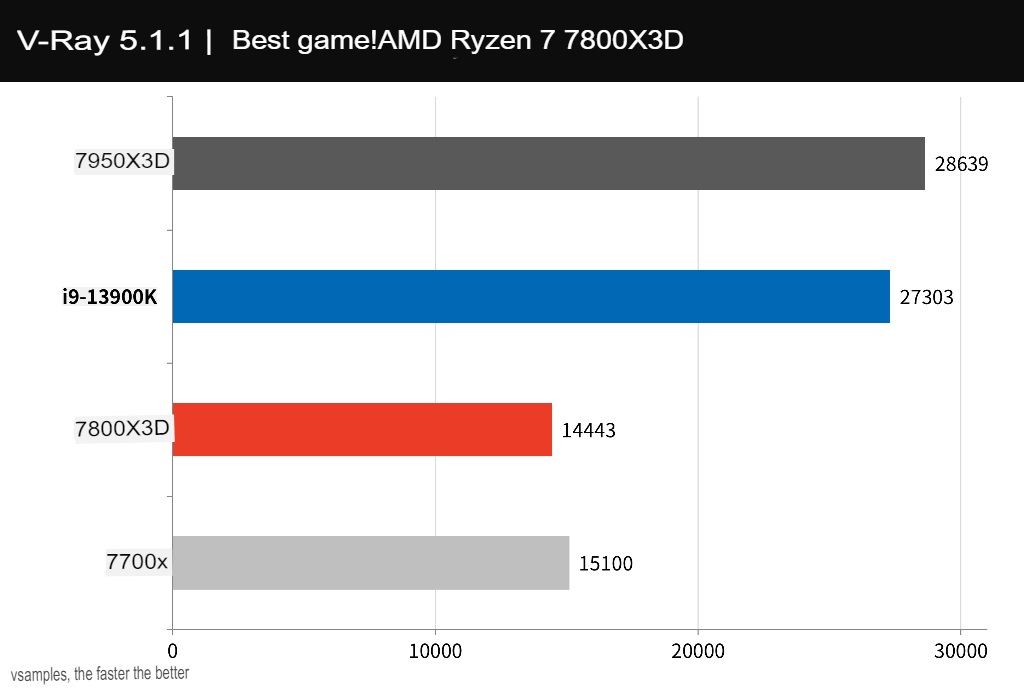
V-Ray Benchmark, developed by Chaos Group, is a ray rendering software based on the principles of physics. This tool evaluates the CPU’s computing performance for ray tracing when rendering images. The CPU score is calculated in v-samples per second as the unit.
The 7800X3D scores 14443 points, representing a 4.4% decrease in computing performance compared to the 7700X.
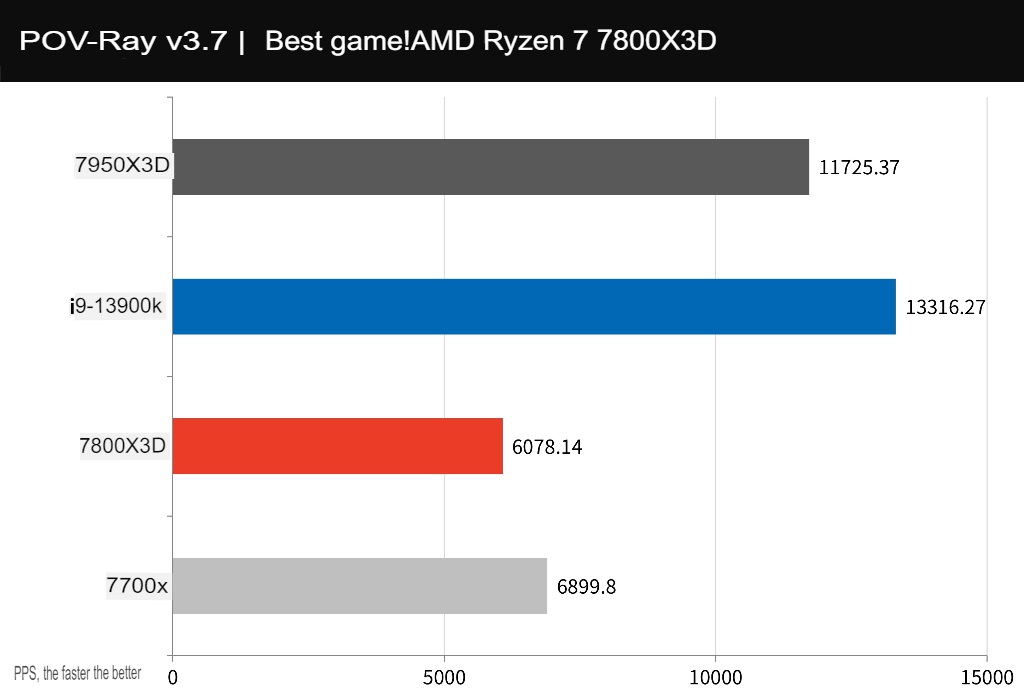
POV-Ray is a free ray tracing 3D rendering toolset that leverages the multi-core CPU’s computing power to calculate light, shadow, and 3D image rendering.
The 7800X3D scores 6078.14 PPS, which is 11% lower than the performance of the 7700X.
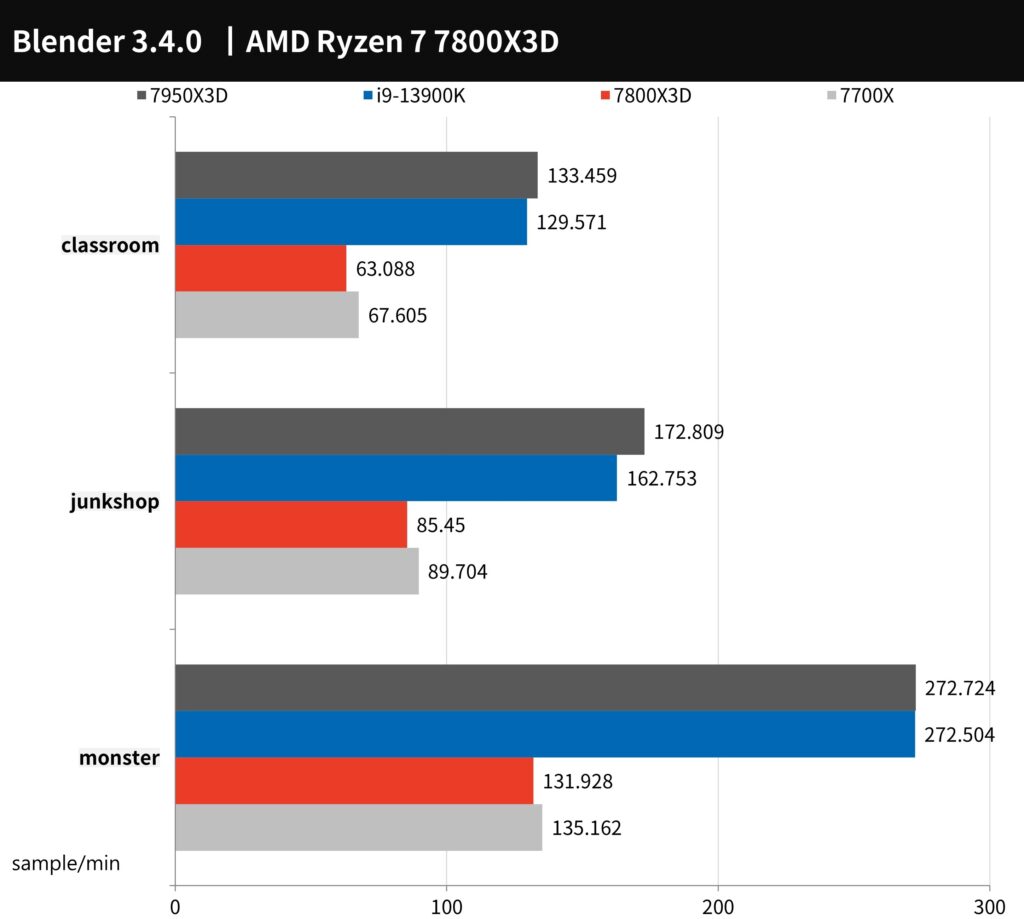
Blender is a cross-platform, open-source 3D creation tool that supports both CPU and GPU rendering acceleration functions. It offers a wide range of 3D operations, including Modeling, Rigging, Animation, Simulation, Rendering, Compositing, and Motion Tracking.
The 7800X3D’s performance in Classroom is 63.088, in Junkshop, it’s 85.45, and in Monster, it’s 131.928, which is 4.6% lower than the performance of the 7700X.
Create PR image output, LR and PS photo editing performance test
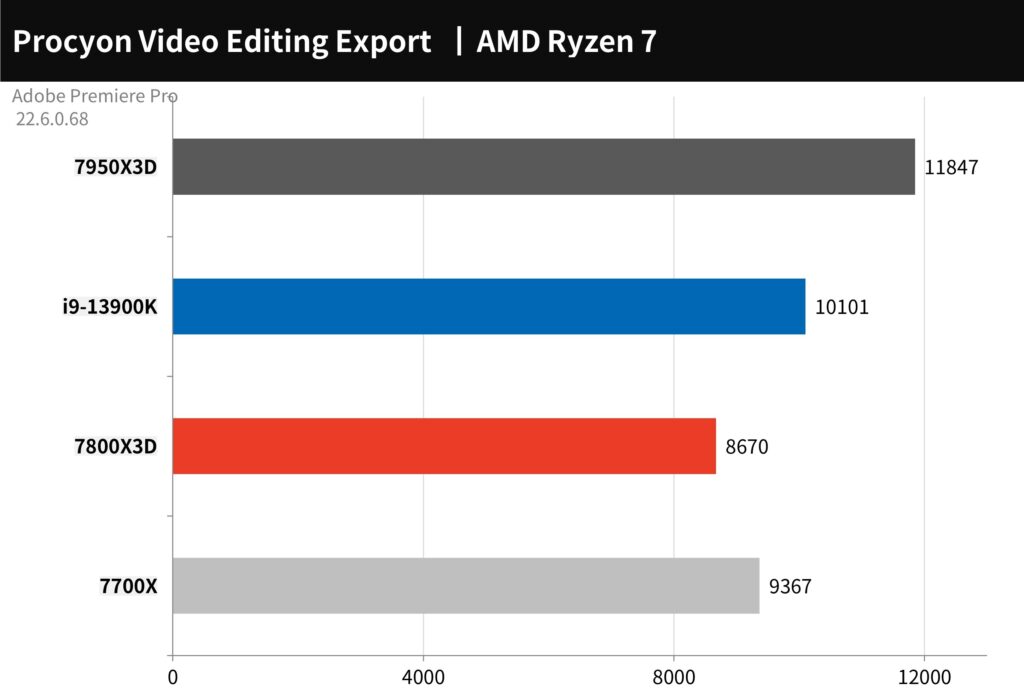
For the Adobe Premiere Pro 2020 conversion output test, we use the UL Procyon Video Editing Benchmark test tool. The test scenario involves using 2160p 30/60 FPS video and outputting it as H.264 – YouTube 1080p Full HD and HEVC (H.265) – 4K UHD formats, comparing the performance of pure CPU output and adding GPU acceleration.
The 7800X3D’s output performance is 8670 points, which is marginally slower than the 7700X. However, when GPU acceleration is added, the difference in performance becomes even smaller.
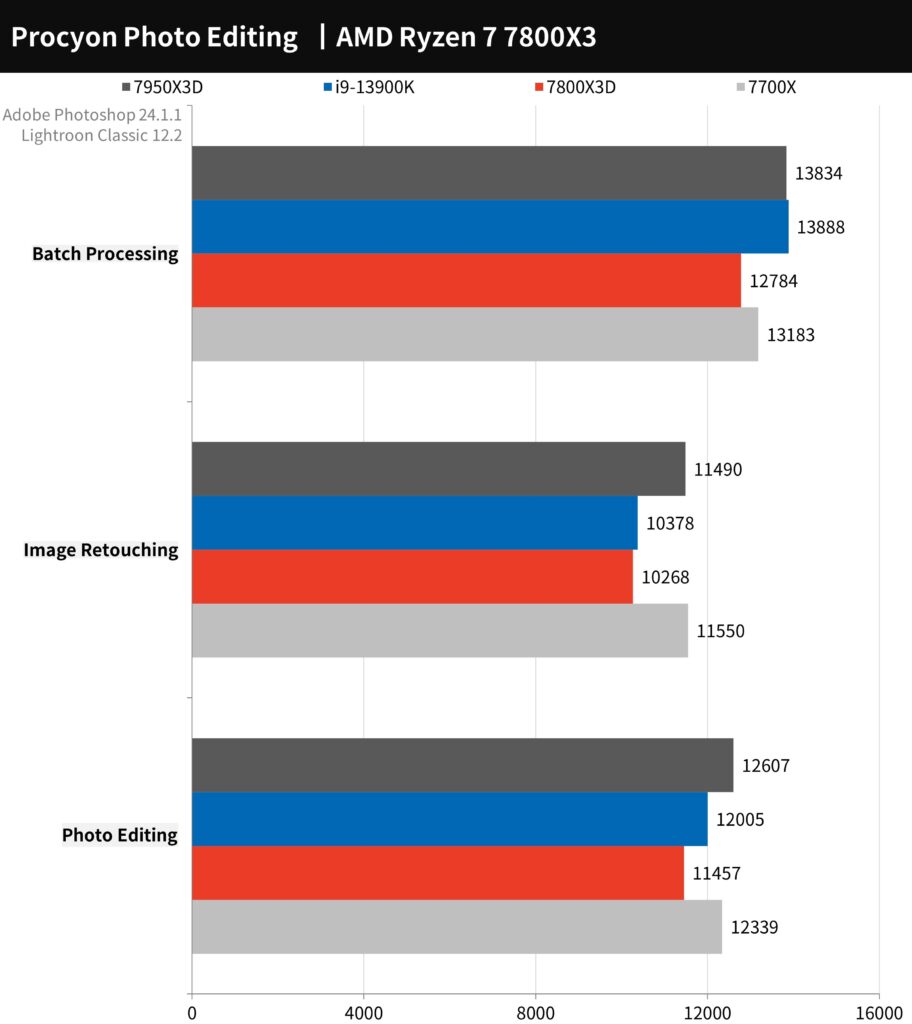
Adobe Photoshop and Lightroom Classic were evaluated using the UL Procyon Photo Editing Benchmark test tool. The test involved two work scenarios: Image Retouching, which uses Photoshop for photo editing and records the time for each step, and Batch Processing, where Lightroom is used to adjust and output a large number of photos in bulk.
The 7800X3D scored a total of 11457 points but still fell short compared to the overall performance of the 7700X.
AIDA64 processor memory, 7-Zip compression test
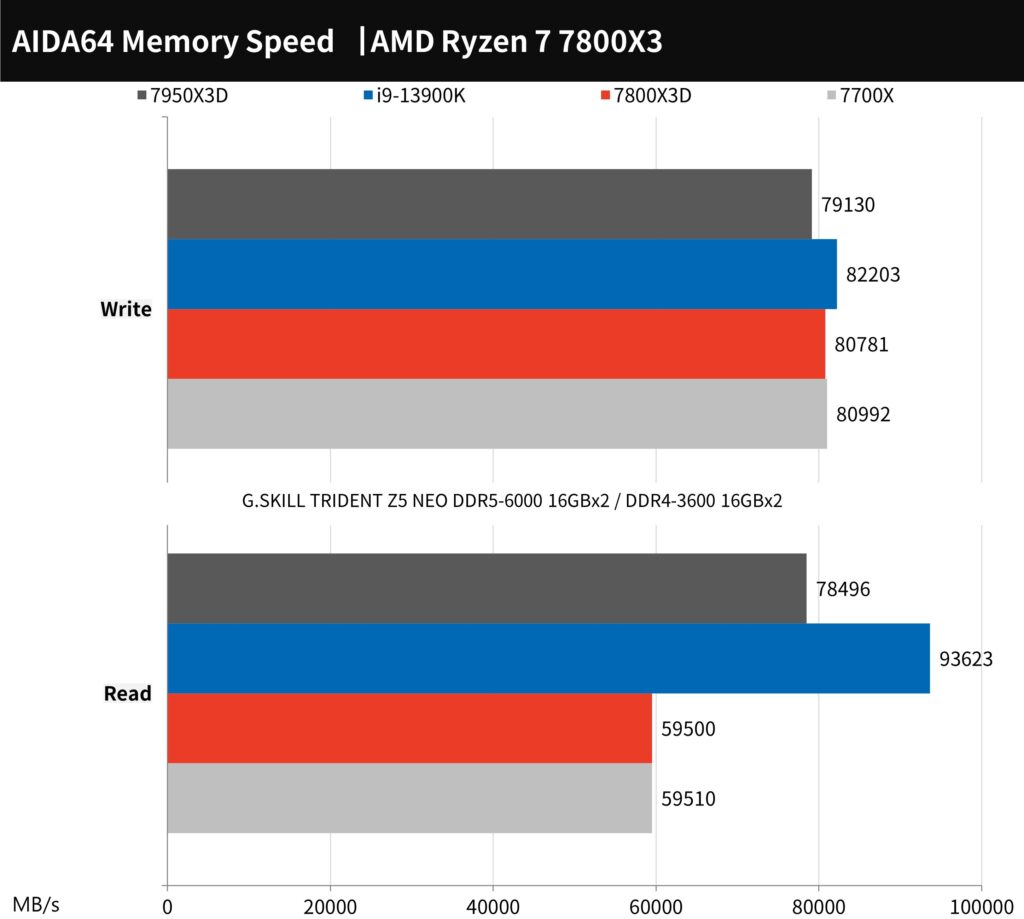
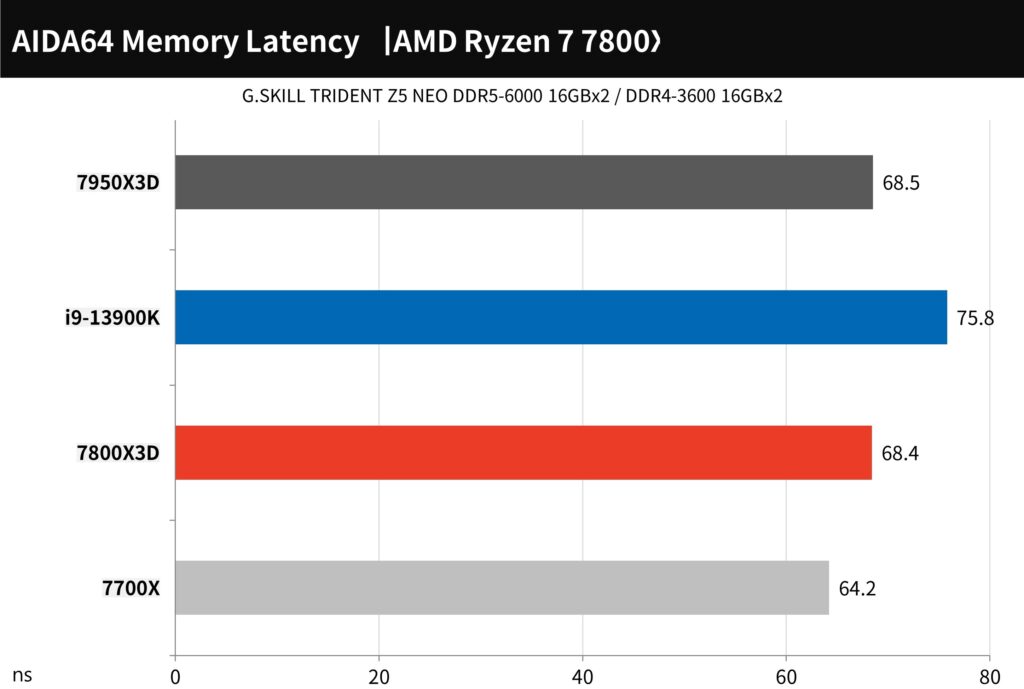
The memory test is conducted using AIDA64, with G.SKILL TRIDENT Z5 NEO DDR5-6000 16GBx2 memory.
The memory performance of the 7800X3D is similar to that of the 7700X, with read speeds of 59,500 MB/s and write speeds of 80,781 MB/s. In terms of memory latency, the 7800X3D has 68.4ns, while the 7700X has 64.2ns.
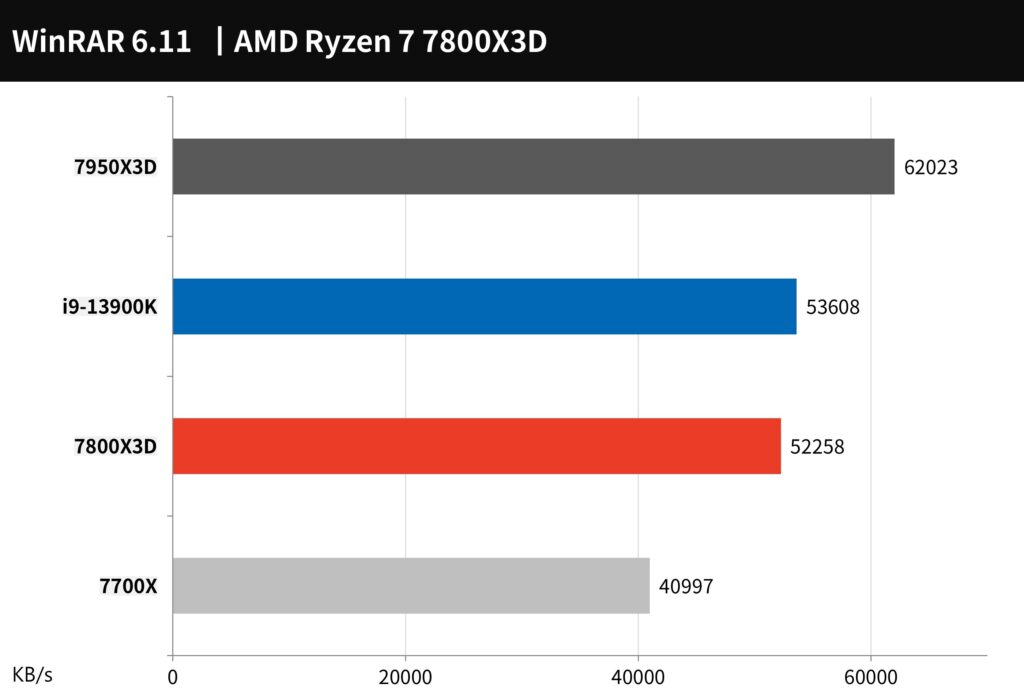
WinRAR is a widely used compression tool, and it is one of the few programs that can improve performance by leveraging the L3 cache. The performance of the 7800X3D reaches 52,258 KB/s, which is 27.5% faster than the 7700X. This demonstrates one of the few applications where L3 cache provides a significant performance advantage.
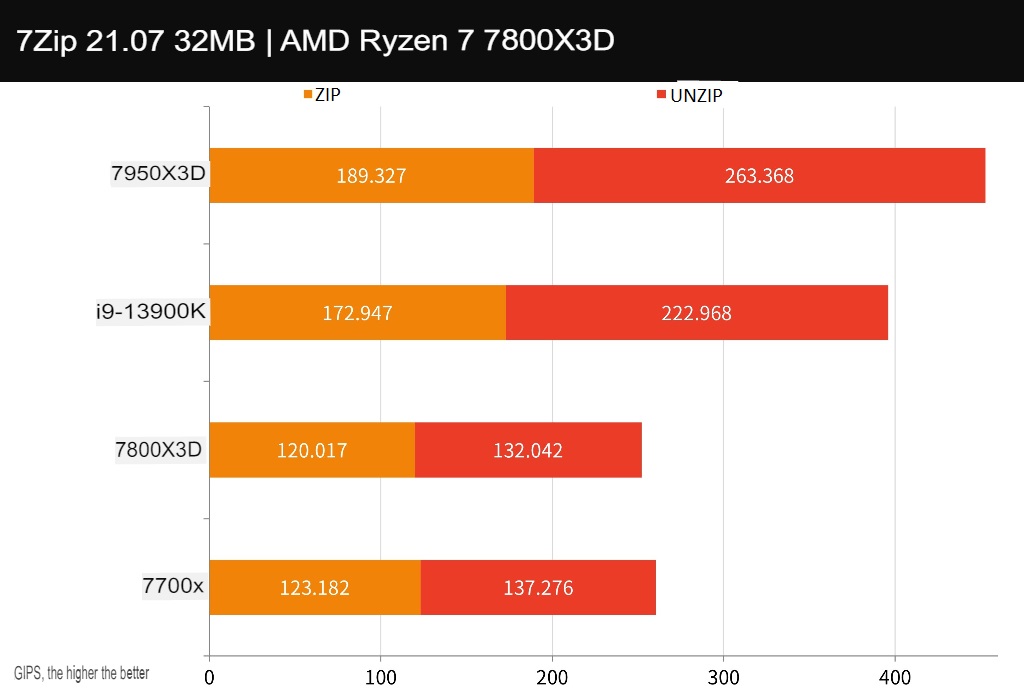
7-Zip is another popular and free compression tool that efficiently leverages multi-core performance. The 7800X3D achieves a compression rate of 120.017 GIPS and a decompression rate of 132.042 GIPS. Its performance is slightly lower than that of the 7700X.
PCMark 10, CrossMark and Office computer performance test
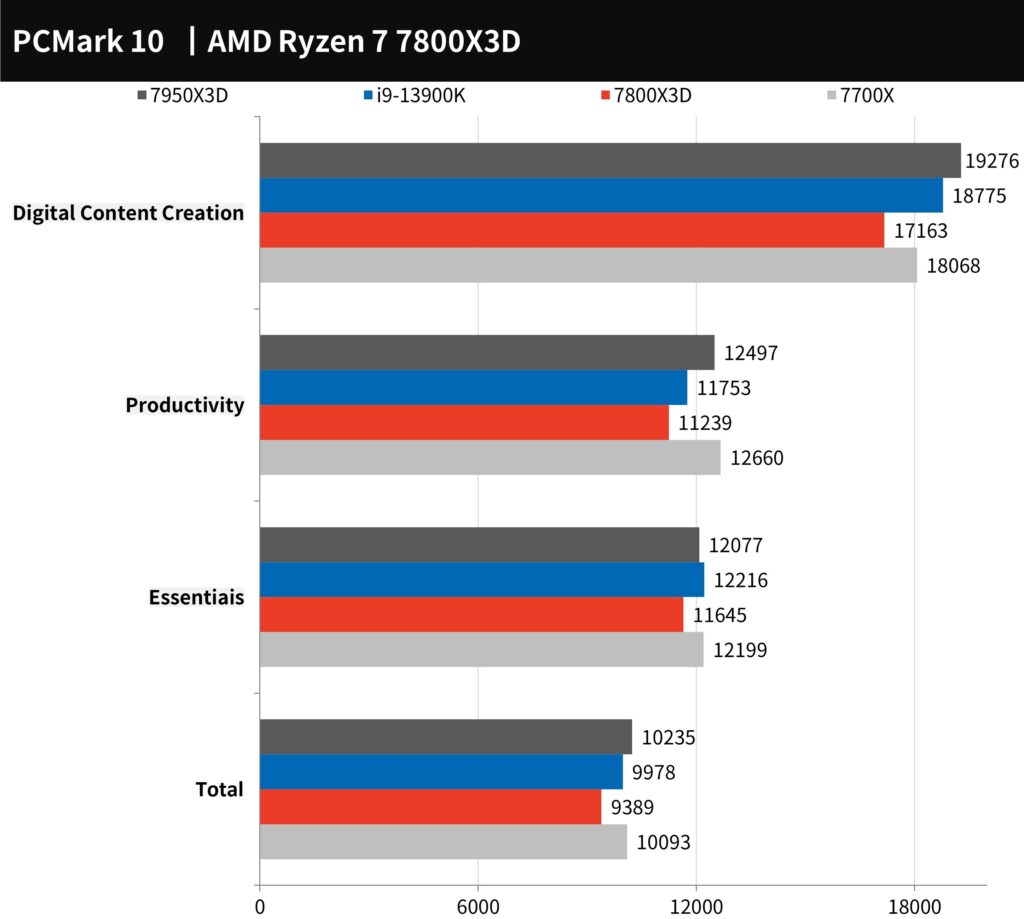
The overall performance of the computer is initially assessed using PCMark 10. The test measures the basic computer tasks in Essentials, such as app startup speed, video conferencing, and web browsing performance. The Productivity test focuses on a spreadsheet and document tasks, while the Digital Content Creation test evaluates photo/video editing, rendering, and visualization.
The 7800X3D achieved a total score of 9389 points, with the overall computer performance being around 7% lower than the 7700X.
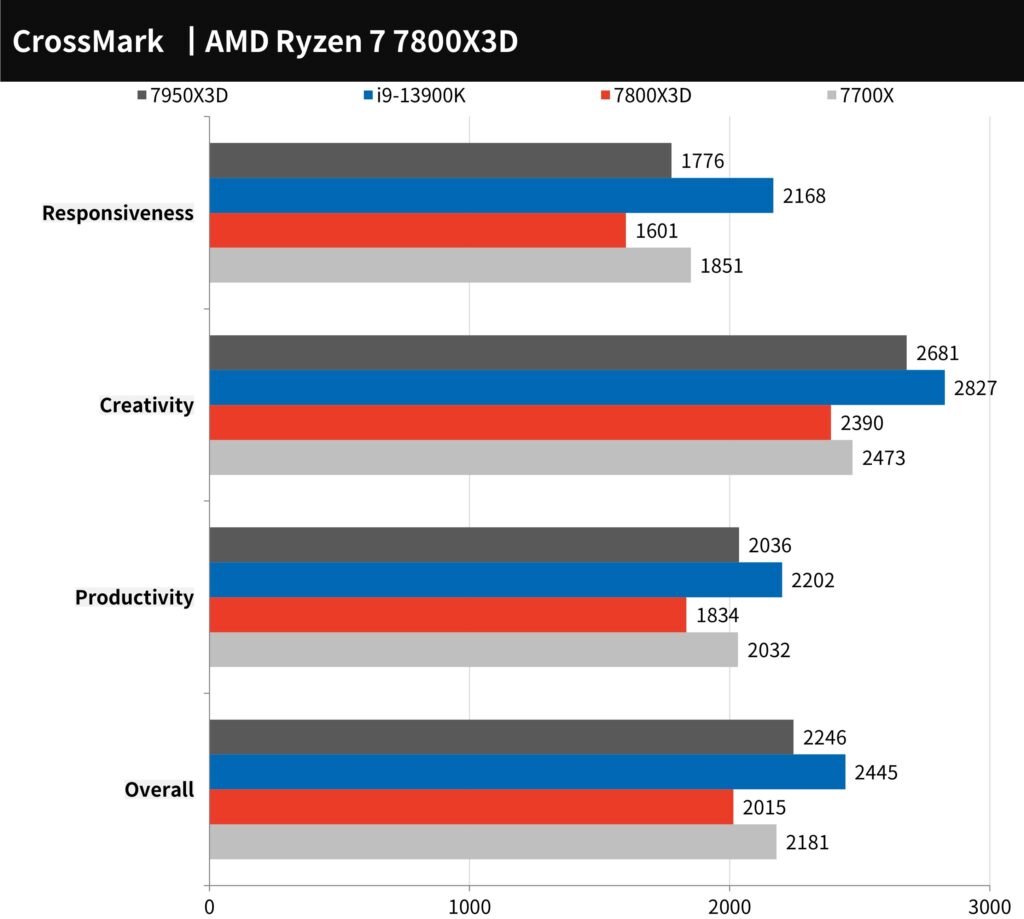
CrossMark is a cross-platform computer performance testing tool developed by BAPCo. It’s a free tool that supports platforms such as Windows, iOS/iPadOS, macOS, and Android. It is designed to evaluate computer productivity, including tasks like text editing, spreadsheets, web browsing, creative photo editing, organizing, and video editing, as well as testing computer response speed.
The 7800X3D scored 2015 points, which is approximately 7.6% lower than the performance of the 7700X.
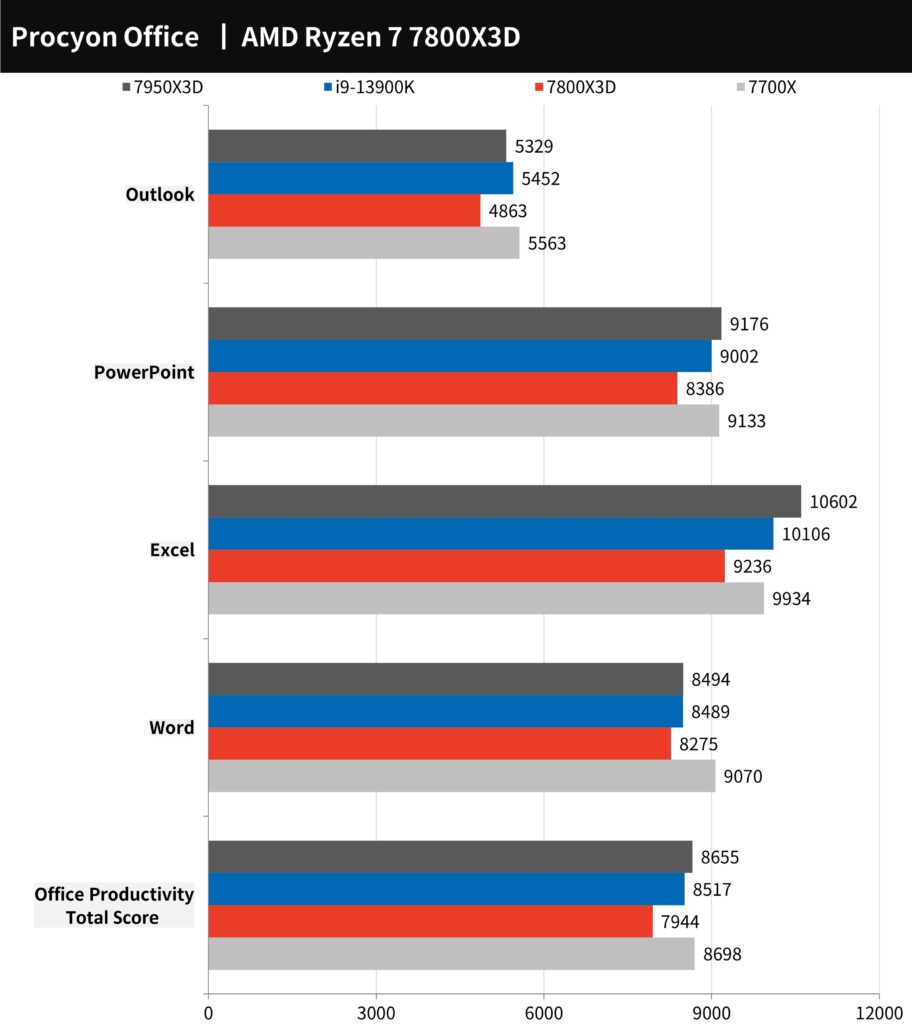
The UL Procyon Office Productivity Benchmark Test evaluates the practical and real-world performance of Windows computers in everyday tasks using Microsoft Word, Excel, PowerPoint, and Outlook. The test scenarios are designed using common office tasks, including opening documents, copying, inputting, performing calculations, sorting, and exporting tables. It also tests adding files, graphics, videos, and emails to presentations.
The 7800X3D scores 7944 points, which is approximately 8.7% lower than the performance of the 7700X.
3DMark CPU Performance and Fire Strike, Time Spy Benchmark Test
3DMark is a computer graphics game performance testing tool featuring the mainstream DirectX 11 test Fire Strike and DirectX 12 Time Spy test.
For the Fire Strike Physics test, the 7800X3D scored 32,784 points, which is 7.8% lower than the 7700X. In the Time Spy CPU test, the 7800X3D reached 13,637 points, which is 4% lower than the performance of the 7700X.
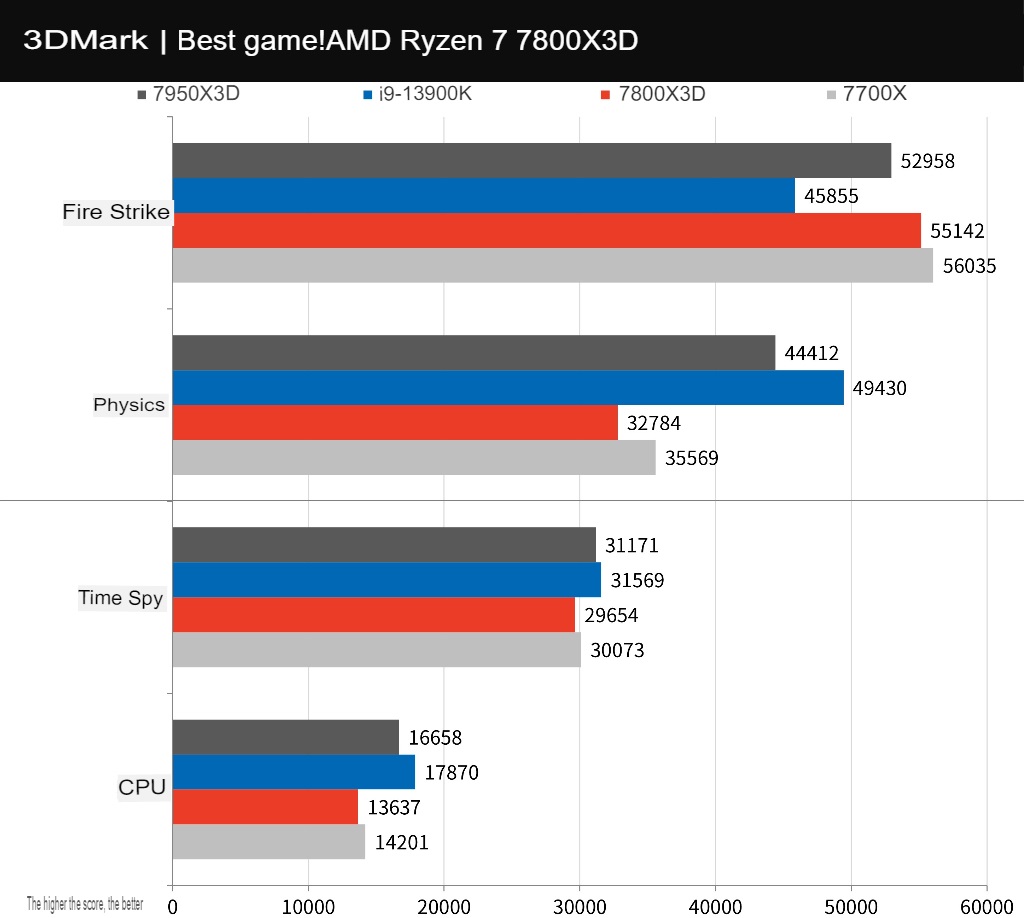
The 3DMark CPU test primarily evaluates the physical calculation and custom simulation work of the CPU. It assesses the processor’s performance with 1, 2, 4, 8, 16, and the maximum number of execution threads, and performance above 16 execution threads is typically used for 3D rendering, audio, and video output. Generally, DirectX 12 games prefer 8T execution threads, while older games prefer fewer execution threads.
In terms of overall performance, the 7800X3D, with a lower clock rate, scored slightly lower than the 7700X, which has a higher clock rate in different thread tests.
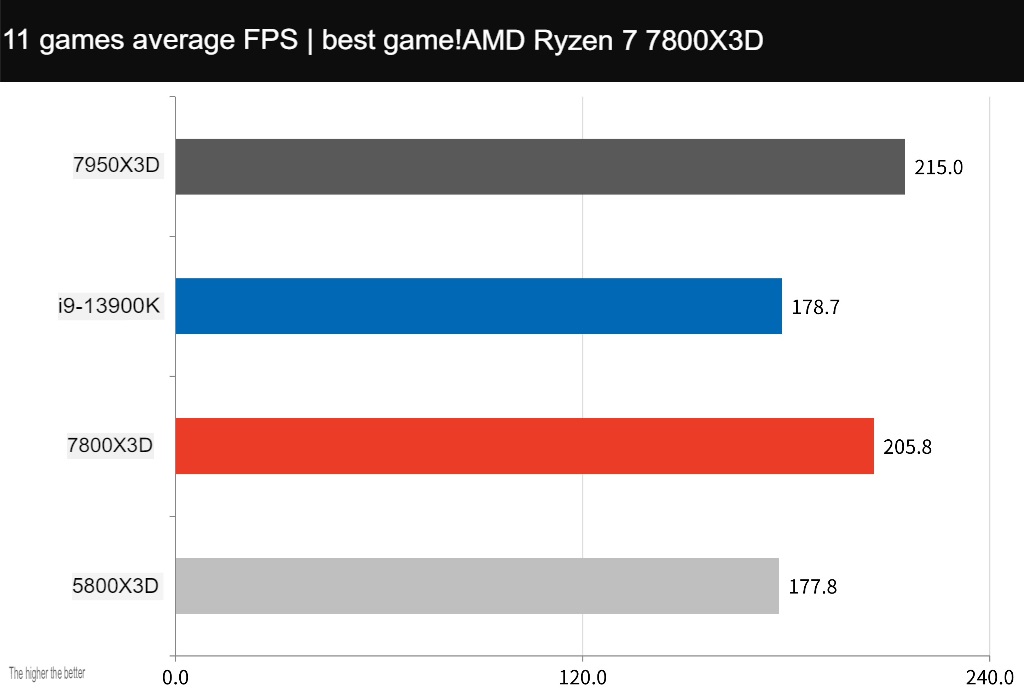
11+4 AAA E-sports Games Test Processor Performance Test
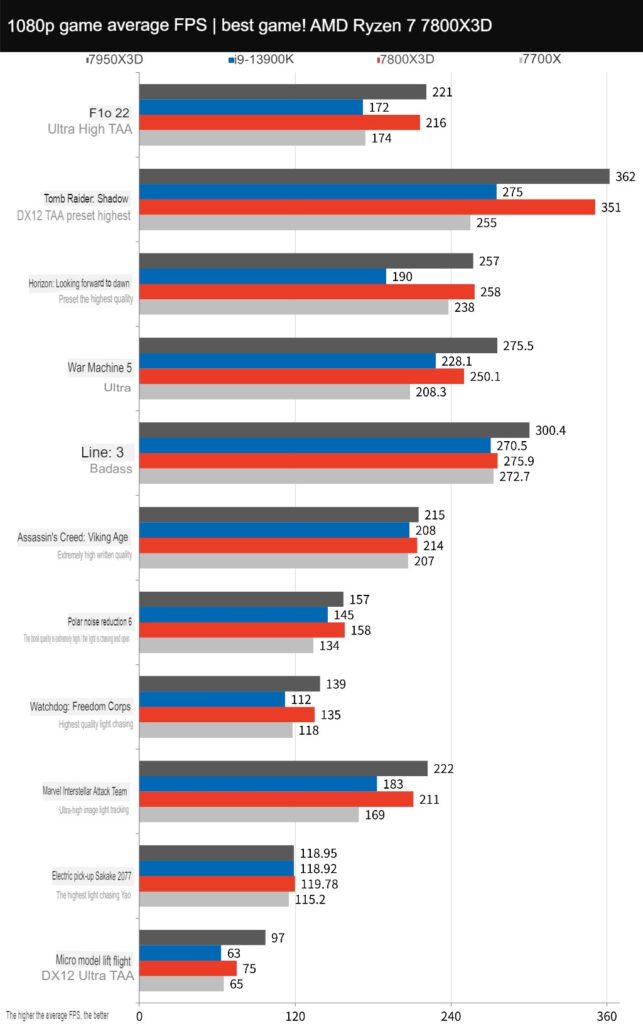
The performance of the 7800X3D processor was tested with 11 AAA games, including the entry-level racing game “F1® 22,” the shooter “Gears of War 5,” the adventure game “Tomb Raider: Shadow,” the action game “Horizon: Waiting for Dawn,” and the heavy performance games “Borderlands 3” and “Assassin’s Creed: Viking Era.” Lighter games, such as “Polar Trench 6,” “Marvel Interstellar Attack Team,” “Watch Dogs,” Freedom Legion, and Dian Yu Ren Ke 2077, were also tested.
Additionally, the test included the heavy CPU performance game, “Microsoft Flight Simulator.” All the tests were conducted at 1080p resolution and the highest default game settings for the In-Game Benchmark test. DLSS and FSR acceleration functions were turned off.
The 7800X3D achieved an average of 205.8 FPS across the 11 games, which is a 15.7% improvement in game performance compared to the 7700X. The 7800X3D’s game performance is only -4.3% behind the 7950X3D.
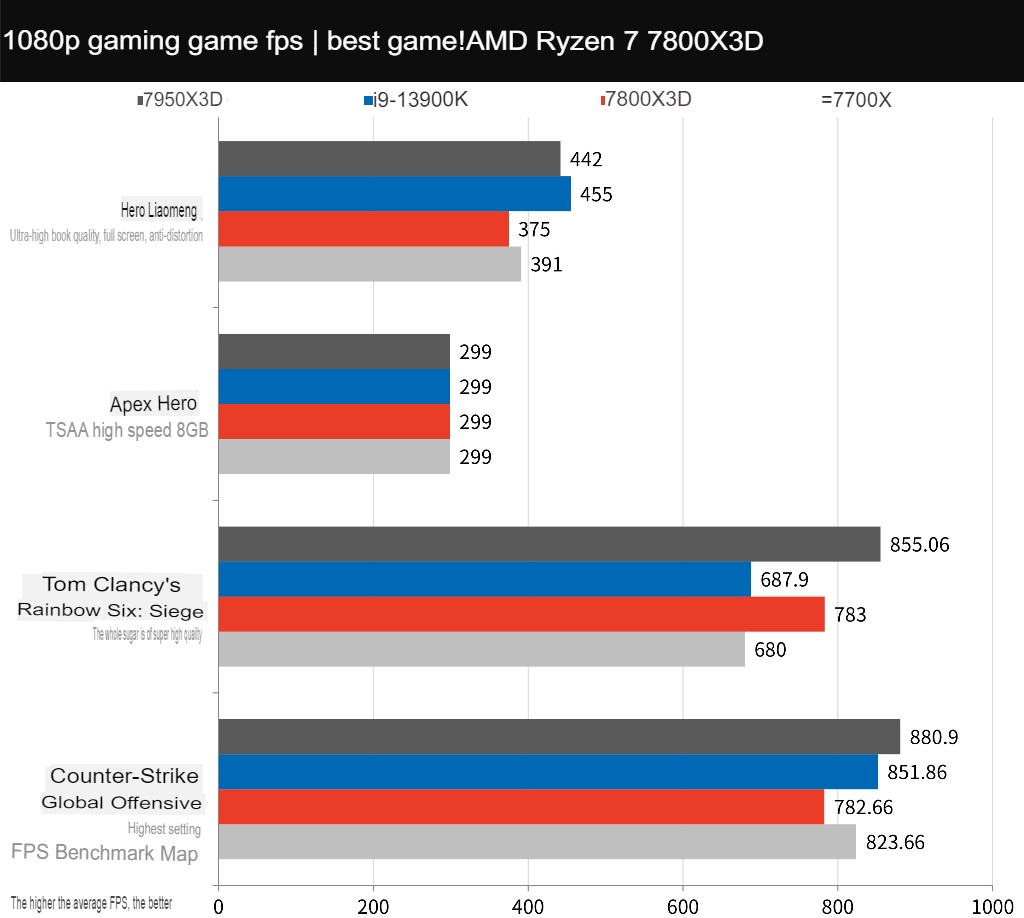
E-sports games prioritize tactical and technical competition over high image quality, which means that they don’t require high-end CPUs and GPUs to achieve high average FPS performance, especially in 1080p resolution. The improvement of CPU performance and clock speed can increase the FPS performance of the game.
The 7800X3D achieved 782.66 FPS in “CS:GO,” an average of 783 FPS in R6 games, and 375 FPS in “League of Legends.” However, the controller doesn’t necessarily get better performance in games like “CS:GO” and “League of Legends.”
AMD Ryzen 9 7800X3D processor temperature and power consumption test
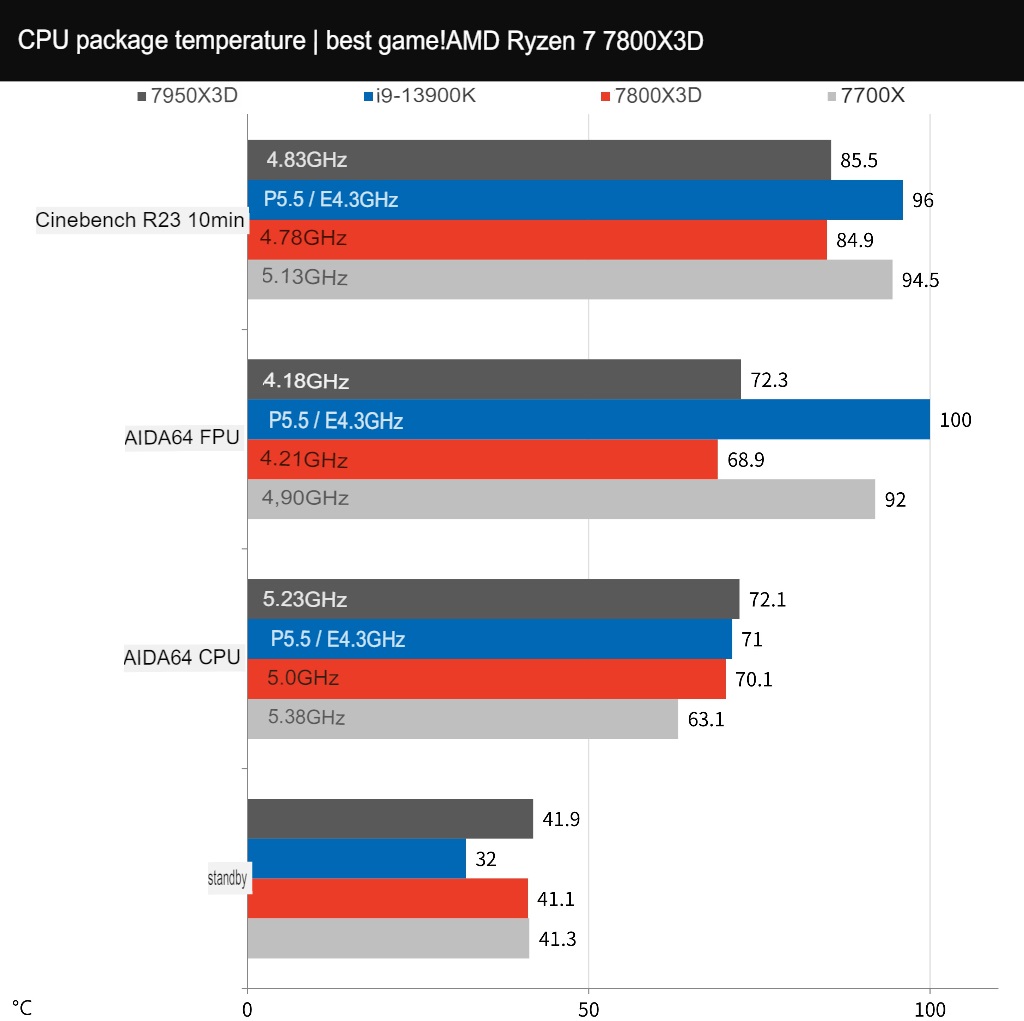
AMD has stated that the 7000X3D processor series, due to the addition of 3D-Vcache, has undergone adjustments to its clock pulse, reducing it to a 120W TDP and optimizing the V/F curve of the processor. This has resulted in better temperature and power consumption performance for the 7800X3D compared to the 7700X. The tests were conducted using a 360mm AIO with the fan and water pump set at full speed, and AIDA64 CPU, FPU, and Cinebench R23 burn-in tests were performed.
During the AIDA64 CPU stress test, the 7800X3D achieved a full-core speed of 5.0GHz with a temperature of 70.1°C. During the FPU test, it achieved a speed of 4.21GHz with a temperature of 68.9°C, and during the Cinebench R23 test, it achieved a speed of 4.78GHz with a temperature of 84.9°C. Due to the low preset TjMax and 3D-Vcache optimization, the temperature of the 7800X3D is relatively better controlled.
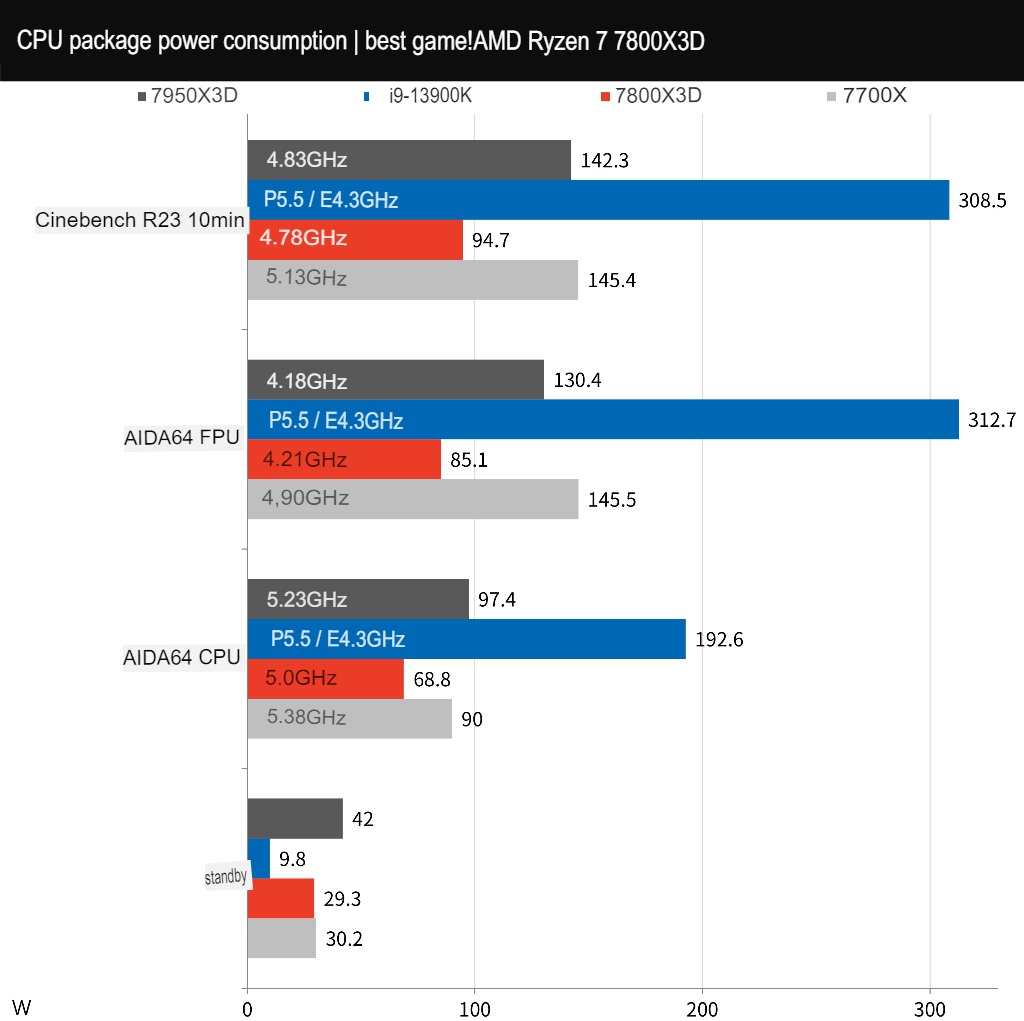
That’s correct. The 7800X3D has a lower clock frequency under stress test compared to the 7700X, but it has better temperature and power consumption performance. The AIDA64 CPU test showed a power consumption of only 68.8W, FPU 85.1W, and Cinebench R23 94.7W. Based on the Cinebench R23 result, the 7800X3D saves 34% power consumption compared to the 7700X and has 41% higher performance per watt.
Summary
The AMD Ryzen 7800X3D exhibits a 15.7% increase in gaming performance, though it falls short of the Ryzen 7950X3D. Nevertheless, it outperforms the i9-13900K by approximately 15.2%. Additionally, the 7800X3D has a 34% lower power consumption compared to 8-core processors of similar calibre. Consequently, its performance per watt has improved by 41%. However, the computer’s multi-core, single-core, and overall performance have decreased by approximately 7%.
Even though the 7800X3D has a better game performance-to-price ratio than the 7700X and 7950X3D, based on the conversion rate from test data of 0.458, it can be considered quite similar to them.
If the price of the Ryzen 7800X3D does not justify its performance, it may not be able to appeal to 1080p gamers. While the 3D V-Cache technology in the processor increases the L3 cache capacity, it does not necessarily improve the performance of general applications. However, it can offer significant performance improvements in 1080p games, and even for games at 2K QHD resolution, but its impact on games at 4K UHD resolution is minimal.
The 7800X3D is set to be released on the evening of April 6th after the embargo is lifted, with a price tag of $449 USD. Its price in Taiwan is expected to be between that of the 7700X and 7900X, which is roughly around 15,000 yuan. It would be disappointing if the asking price is too high since gamers may not be willing to allocate a large budget for a processor when it comes to game performance.
If this article is helpful for you, please share this article with your friends on social media. Thank you!
This article is based on the personality of the reviews. You are responsible for fact-checking if the contents are not facts or accurate.
Title: The supreme gaming experience! AMD Ryzen 7 7800X3D Processor Review / Unmatched Gaming Performance for the Price