Intel, a well-known brand, stands out with its innovations. The 12th generation Alder Lake introduced a hybrid core design, marking its first use. This mix of P + E Core managed to outperform Ryzen. With the 13th generation Raptor Lake, the E-Core count was doubled, the P-Core frequency was raised, and it was supplemented with a more expansive L2 cache. This gave it an edge over Ryzen in both multi-core and gaming performance. Yet, in the 14th generation Raptor Lake Refresh, only the i7-14700K received notable core and cache enhancements. The i9-14900K and i5-14600K saw merely frequency boosts, with no changes in the process or architecture. So, without significant changes, what more can one anticipate?
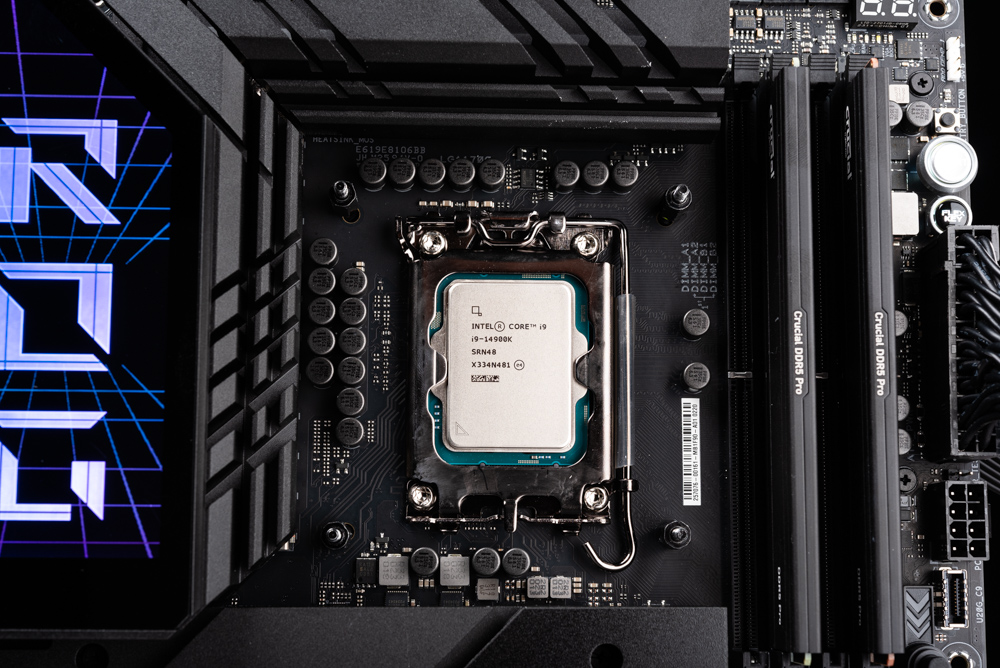
14th generation Intel Core K series overclocked processors: i9-14900K, i7-14700K, i5-14600K
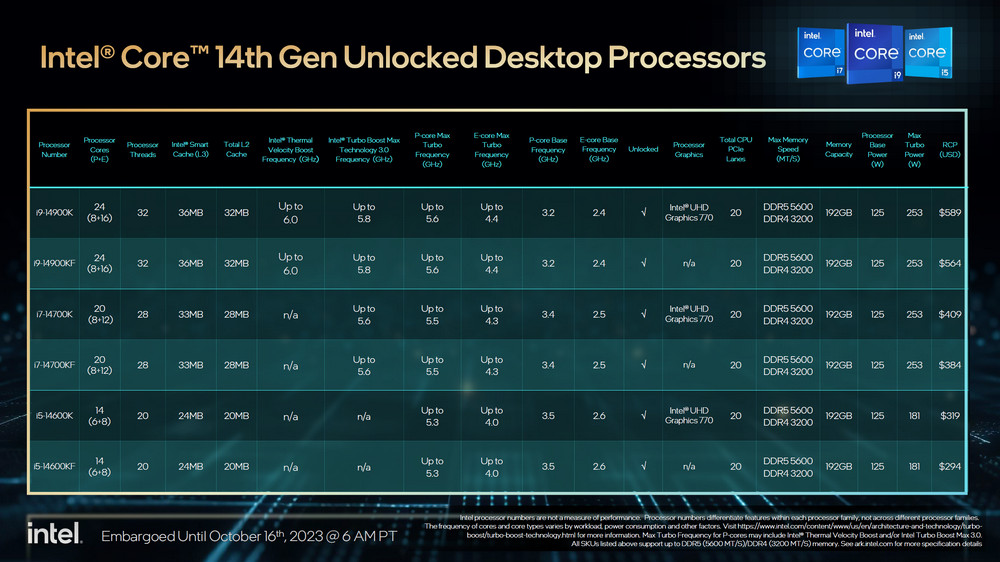
The 14th generation of Intel Core processors might be considered one of the least revolutionary iterations in Intel’s lineage, sticking to the existing Raptor Lake design and unchanged process (similar to how 14nm+++ was previously retained). However, the standout of this generation is definitely the i7-14700K. It boasts enhanced L2 and L3 caches, an additional 4 E-Cores, and a boosted clock speed reaching up to 5.6GHz Turbo.
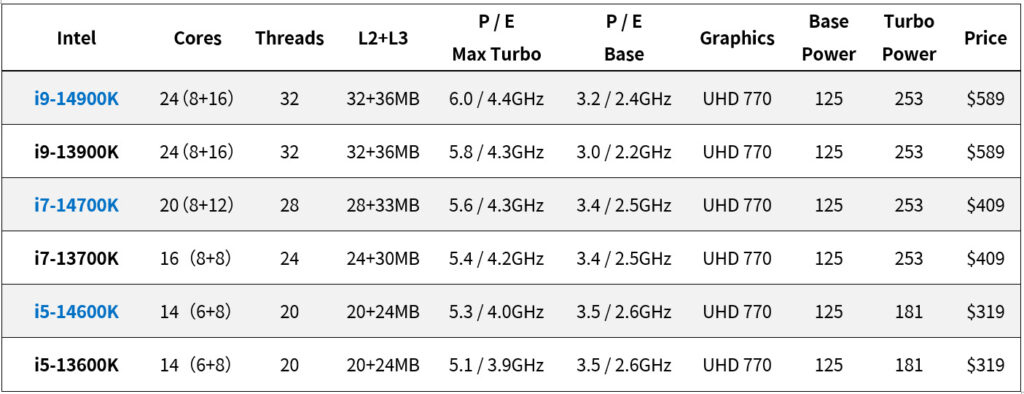
For the i9-14900K and i5-14600K, the only enhancement comes in the form of increased clock speeds. Notably, the i9-14900K is the first mass-produced chip capable of hitting 6GHz Turbo straight from the factory, assuming the cooling system can manage it. This processor is specifically engineered to reclaim the title from the 7950X3D as the premier gaming CPU.
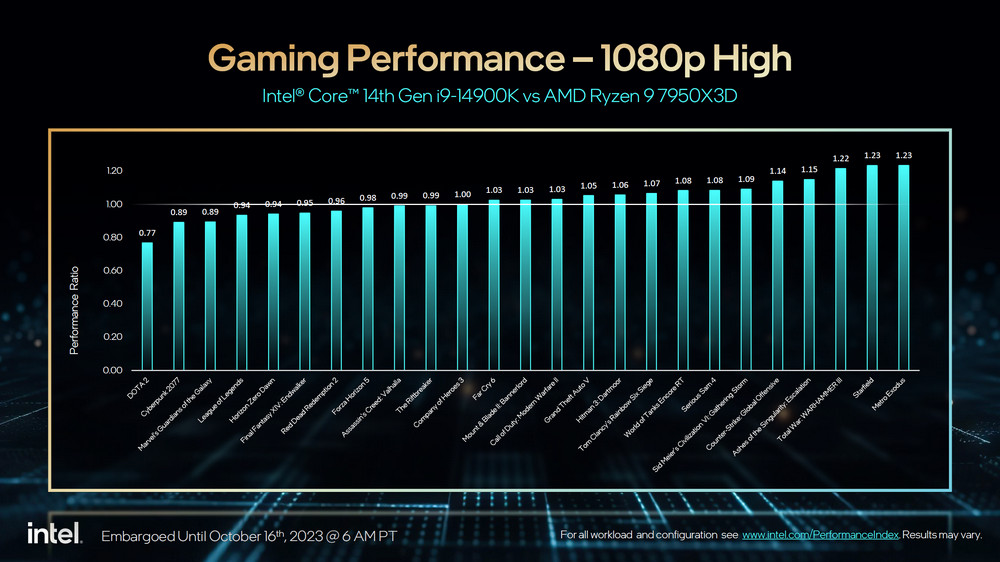
The results were intriguing in a 1080p gaming showdown between the i9-14900K and the 7950X3D. Out of numerous games tested, 14 favored the i9-14900K due to its superior clock speed and reduced latency. However, 10 games showcased a preference for a CPU with a larger L3 cache.
Price-wise, the 14th generation Intel Core K series overclocked processors retain the same price tags as their 13th generation predecessors: i9-14900K at US$589, i7-14700K at US$409, and i5-14600K at US$319. Nevertheless, given the current market conditions and ample supply of the 13th generation processors, the 14th generation might see a slight uptick in price when converted to Taiwan dollars.
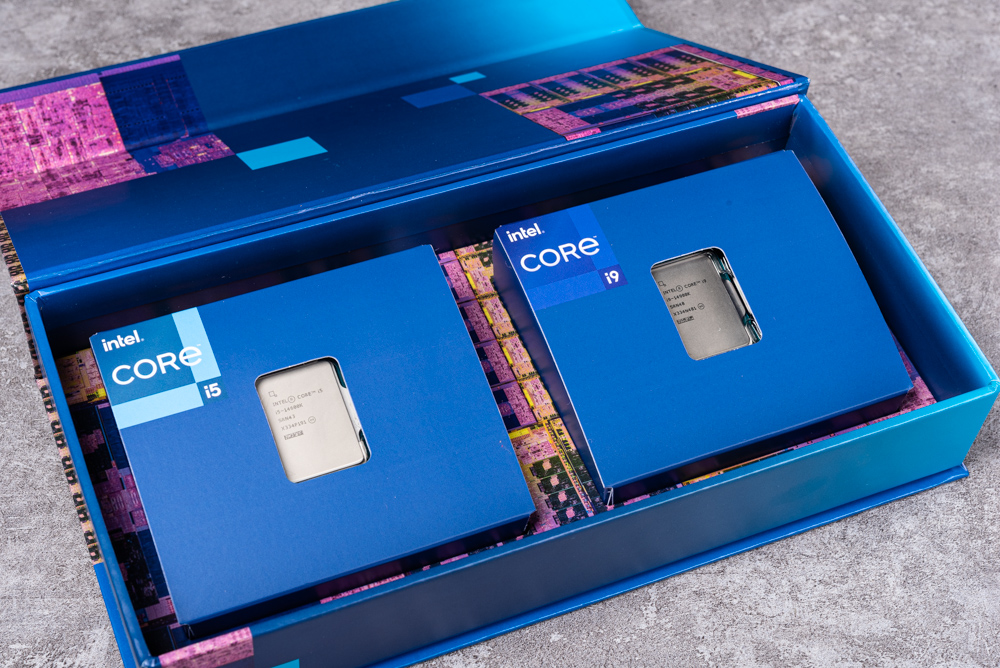
Media version Intel Core i9-14900K and i5-14600K unboxing
In this round of evaluations, while Intel supplied the i9-14900K and i5-14600K for testing, we also sourced the i7-14700K to include in our comparisons.
Test platform and settings
This assessment primarily targets the i9-14900K, i7-14700K, and i5-14600K, measuring their performance advancements against the prior generation models: i9-13900K, i7-13700K, and i5-13600K. Additionally, the Ryzen 9 7950X is included for contrast. However, for many enthusiasts, the upgrades this generation brings might seem negligible, with only the i7-14700K displaying significant enhancements.
For this evaluation, the motherboard settings were left on Auto. We used DDR5-6000 XMP memory and cooled the system with the ROG RYUJIN III 360 liquid cooler. The testing setup is detailed below for reference:
Test Setup:
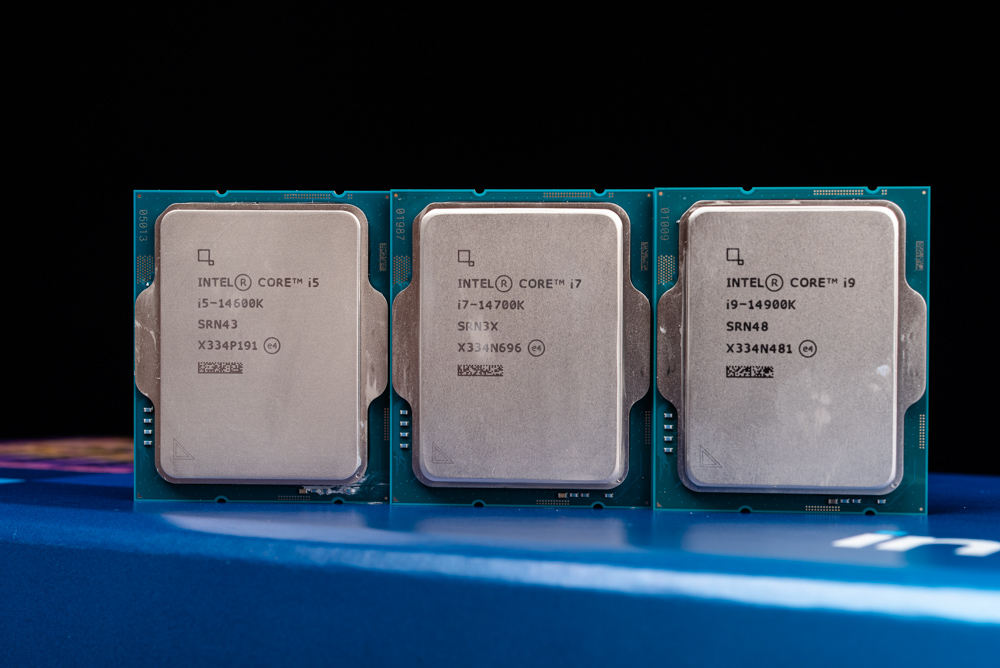
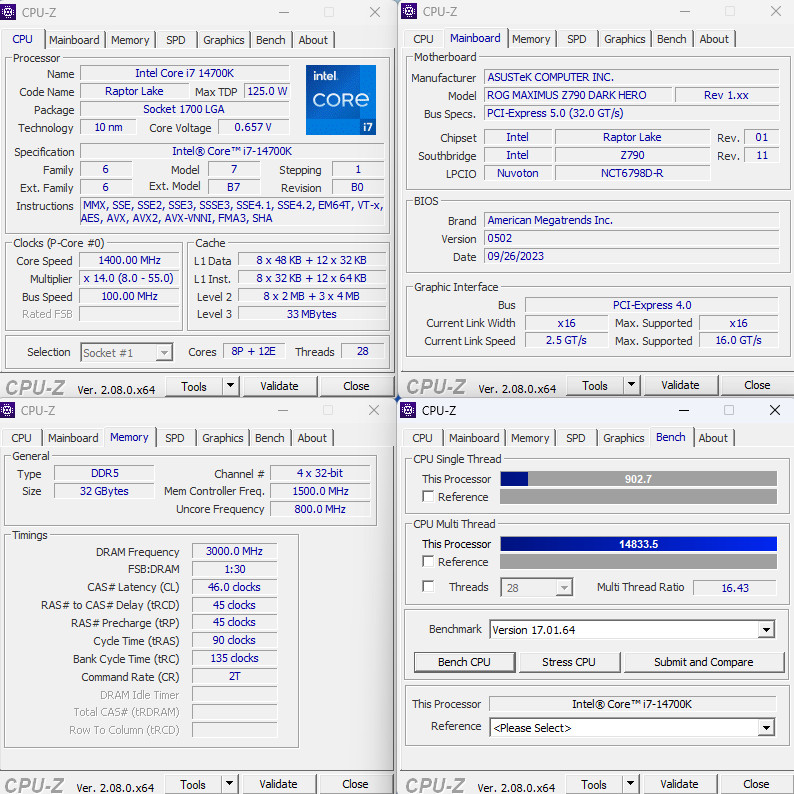
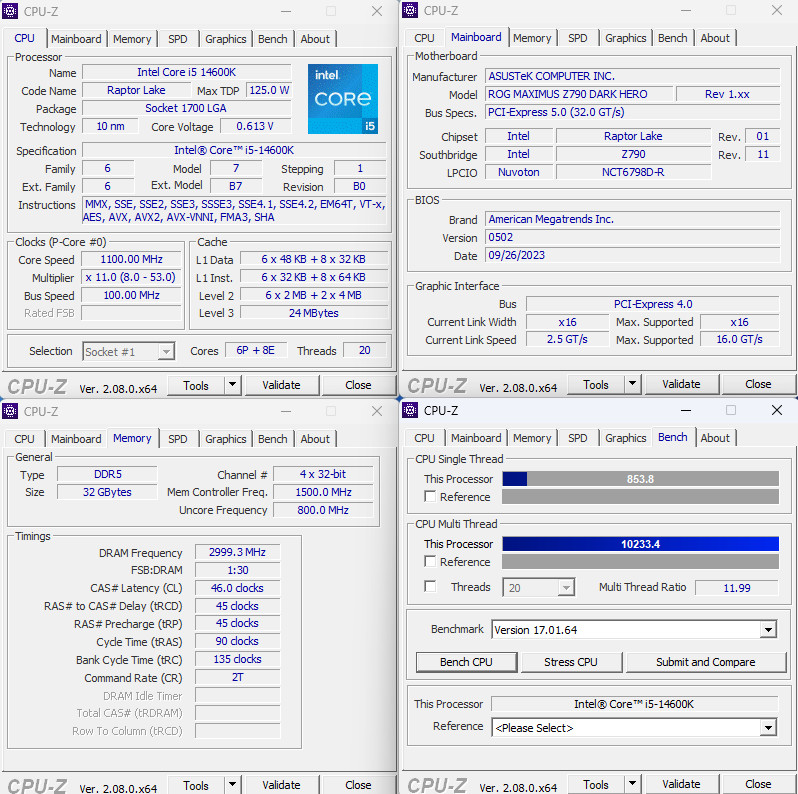
- Processor: Intel Core i9-14900K, i7-14700K, i5-14600K
- Motherboard: ASUS ROG MAXIMUS Z790 DARK HERO
- Memory: CRUCIAL PRO DDR5-6000 16GBx2
- Graphics card: NVIDIA GeForce RTX 4090
- Storage: Solidigm P44 Pro 1TB PCIe 4.0 SSD
- Cooling System: ROG RYUJIN III 360
- Power Supply: Seasonic VERTEX 1000W
- Operating System: Windows 11 Pro 22H2
For the Ryzen:
- Processor: AMD Ryzen 9 7950X
- Motherboard: ASUS ROG CROSSHAIR X670E HERO
Processor computing performance Cinebench, Corona, VRay, Blender rendering test
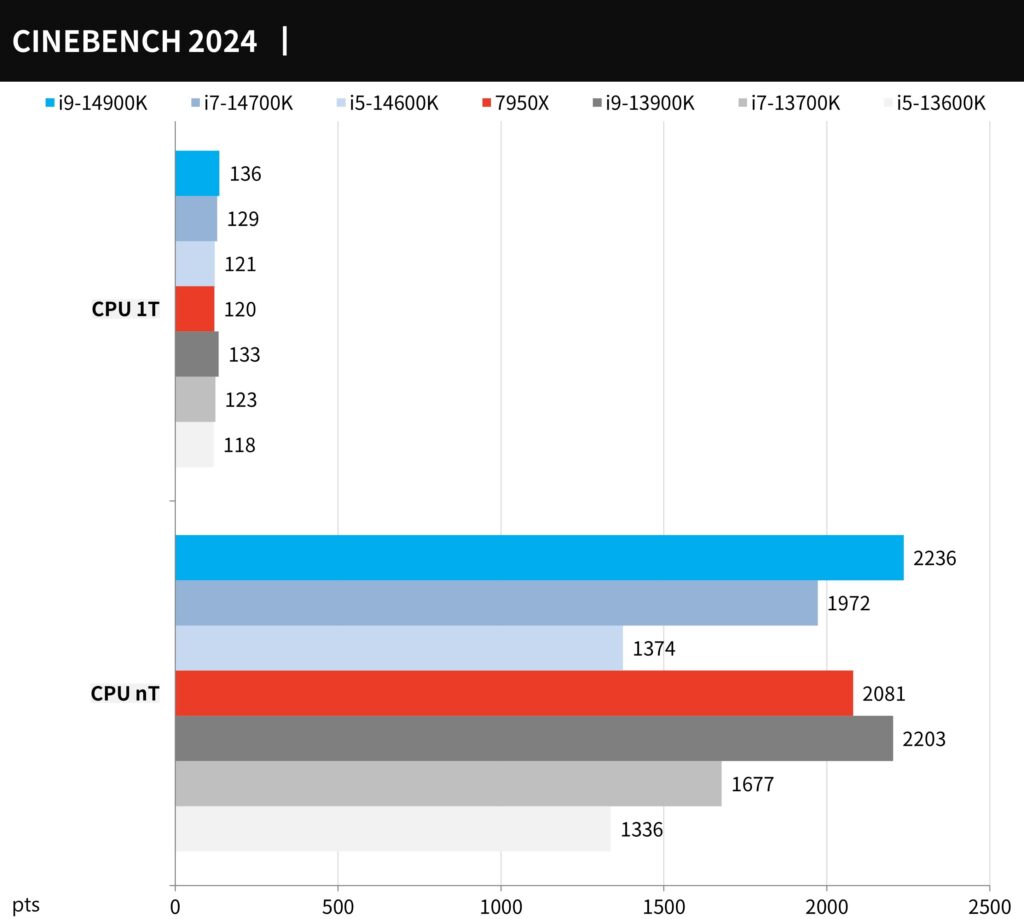
The 2024 version of CINEBENCH has been fully reimagined using Cinema 4D’s native Redshift rendering engine. It now provides comprehensive tests for both GPU and CPU and offers compatibility for cross-platform performance analysis. This version not only boasts higher accuracy and speed but also increases the volume of multi-threaded rendering scene computations by six-fold compared to its predecessor, the R23 version. As a result, the CPU test mandates a minimum of 16GB memory, while the GPU test necessitates at least 8GB VRAM.
In the multi-threaded test, scores were as follows: i9-14900K with 2236 points, i7-14700K with 1972 points, and i5-14600K with 1374 points. For single-threaded performance, the i9-14900K scored the highest at 136 points, followed by the i7-14700K at 129 points, and the i5-14600K at 121 points.
When matched up against their respective predecessors:
- The i9-14900K showed an incremental increase in performance by 1% in multi-threaded (nT) and 2% in single-threaded (1T) tests compared to the i9-13900K.
- The i7-14700K experienced a significant rise, registering a 17.6% performance boost in nT and 4.9% in 1T over the i7-13700K.
- The i5-14600K demonstrated a modest improvement of 3% for both nT and 1T when set against the i5-13600K.
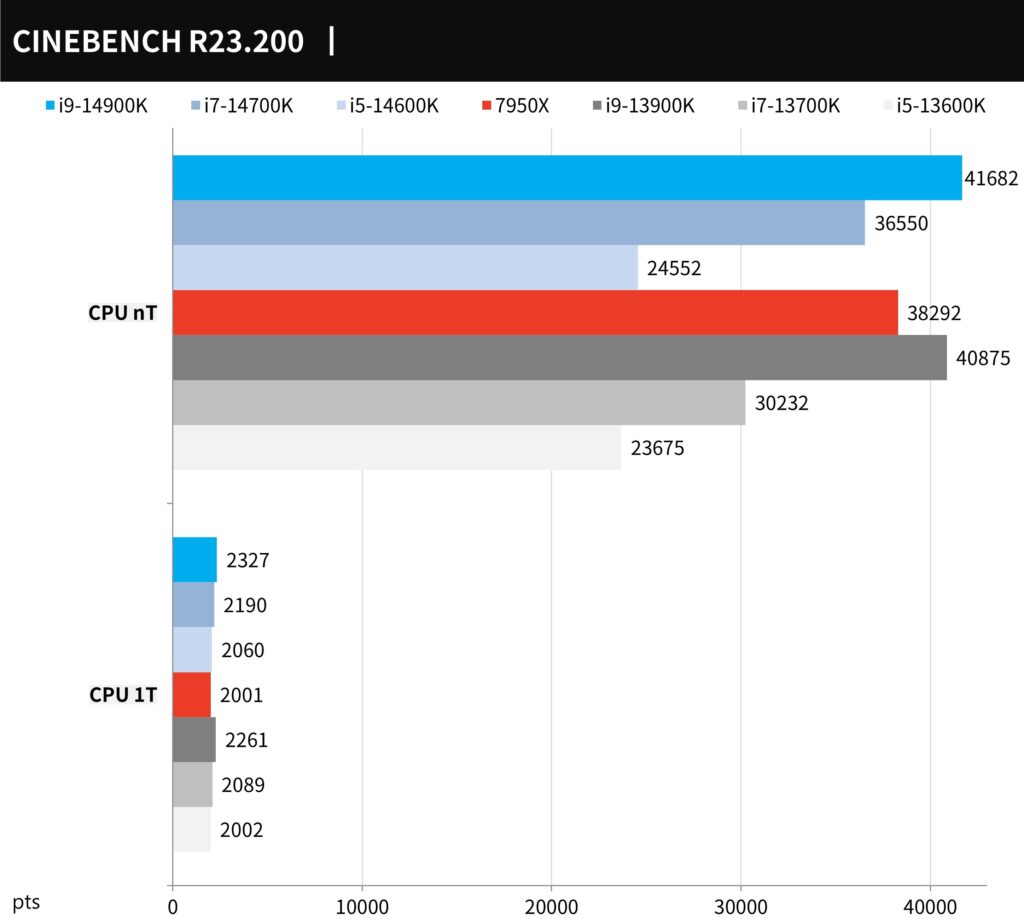
CINEBENCH R23 retains the testing conditions of R20 but incorporates a new compiler and introduces a stress testing feature. Users have the flexibility to set their preferred Minimum Test Duration, such as 10 or 30 minutes, to gauge system stability. However, it’s essential to note that R23’s results are not directly comparable to those from R20.
For the multi-threaded tests, the scores were: i9-14900K at 41682 points, i7-14700K at 36550 points, and i5-14600K at 24552 points. On the single-threaded front, the i9-14900K led with 2327 points, followed by the i7-14700K at 2190 points and the i5-14600K at 2060 points.
Comparatively:
- The i9-14900K showcased a modest boost of 2% in multi-threaded (nT) and 3% in single-threaded (1T) performance against its predecessor, the i9-13900K.
- The i7-14700K saw a marked improvement, with a 20.9% rise in nT and 4.8% in 1T over the i7-13700K.
- The i5-14600K recorded a 3% growth in both nT and 1T when compared to the i5-13600K.
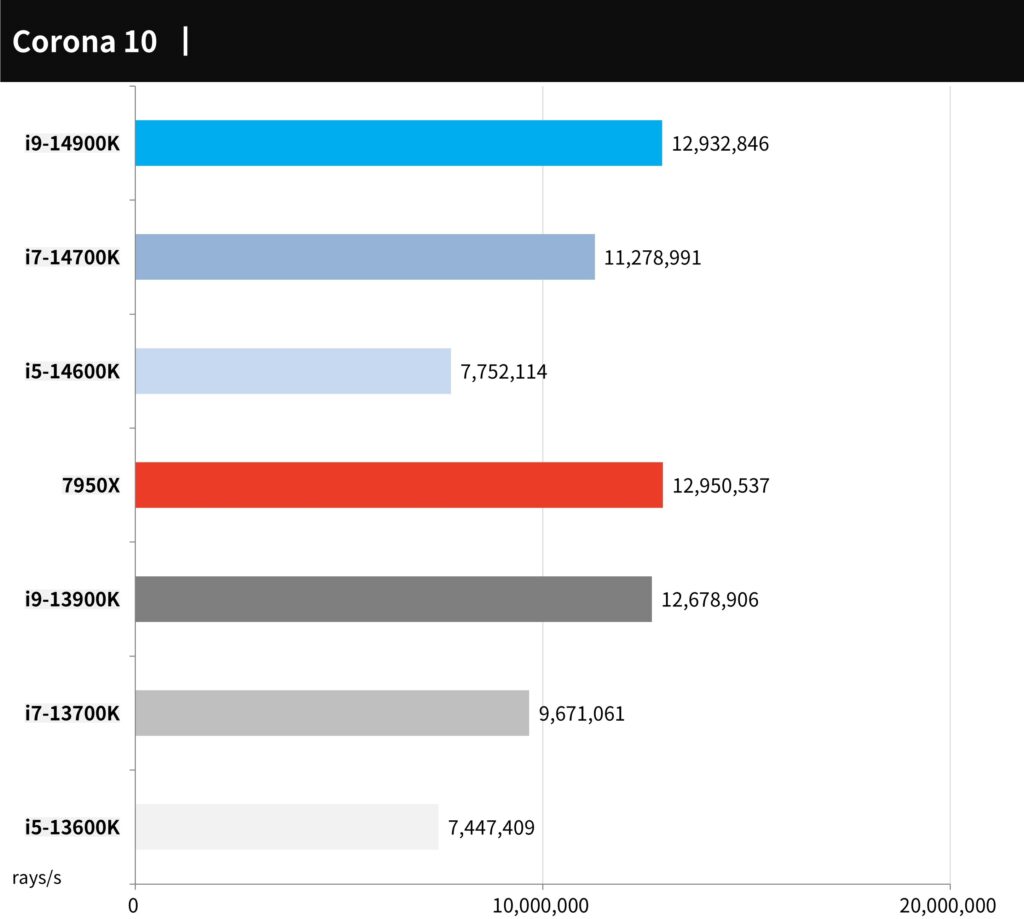
The updated Corona Benchmark is built on the Corona 10 rendering engine. The test is straightforward, assessing the processor’s ability to process rendering rays within a minute (measured in rays-per-second). A higher score signifies superior performance.
In the assessment:
- The i9-14900K achieved 12,932,846 ray/s,
- The i7-14700K registered 11,278,991 ray/s,
- The i5-14600K scored 7,752,114 ray/s.
When juxtaposed with their predecessors:
- The i9-14900K demonstrated a 2% enhancement in rendering prowess over the i9-13900K.
- The i7-14700K exhibited a 16.6% leap in performance against the i7-13700K.
- The i5-14600K showed a modest 4% uptick when matched with the i5-13600K.
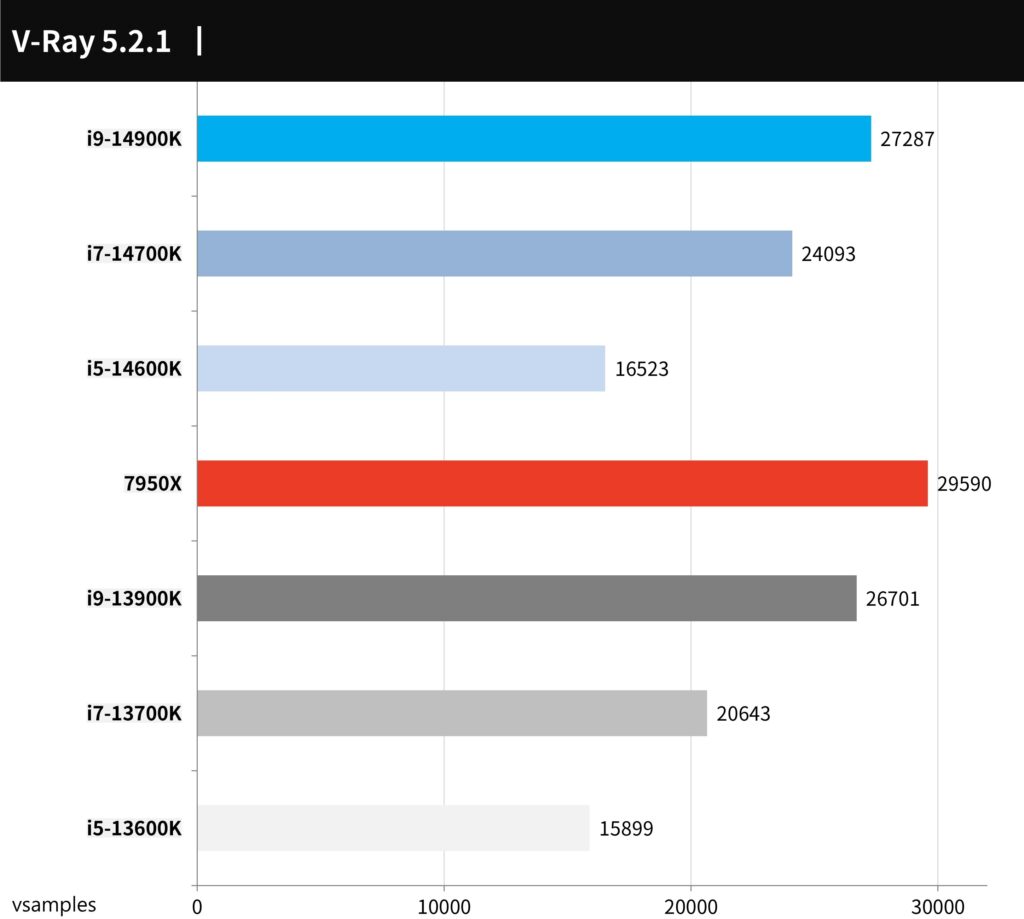
Chaos Group developed the V-Ray Benchmark, a tool based on the principles of physics that assesses the ray tracing rendering capabilities of CPUs. The results are quantified in terms of samples per second.
In the tests:
- The i9-14900K achieved a rate of 27,287 samples per second,
- The i7-14700K clocked in at 24,093 samples per second,
- The i5-14600K managed 16,523 samples per second.
When stacked against their previous models:
- The i9-14900K displayed a 2% increase in rendering performance compared to the i9-13900K.
- The i7-14700K exhibited a boost of 16.7% against the i7-13700K.
- The i5-14600K showed a modest uptick of 4% compared to the i5-13600K.
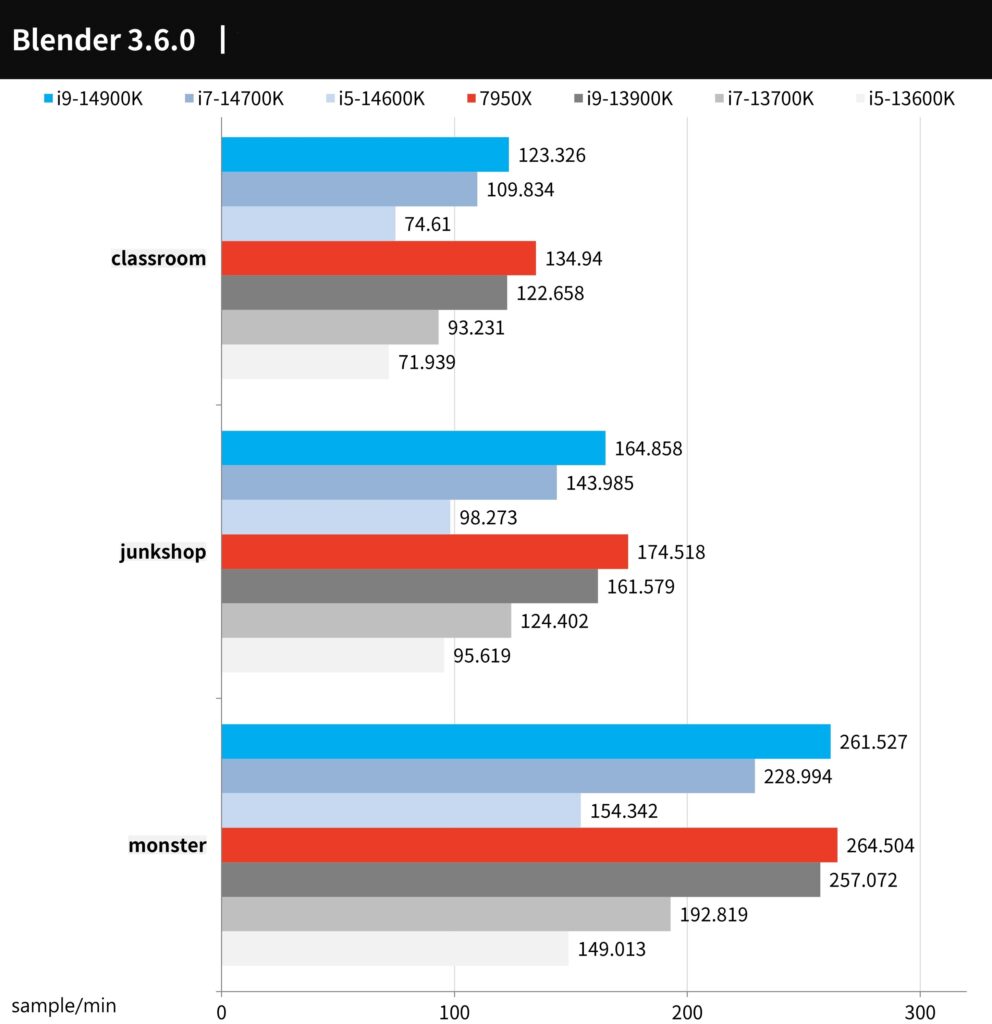
Blender is a versatile, open-source 3D tool available across platforms. It provides an array of 3D functionalities including Modeling, Rigging, Animation, Simulation, Rendering, Compositing, and Motion Tracking, with the added advantage of supporting both CPU and GPU rendering accelerations.
In the rendering tests:
- The i9-14900K showed a modest performance improvement, varying between 1-2% over its predecessor, the i9-13900K.
- The i7-14700K marked a significant leap of 18.8% when compared to the i7-13700K.
- The i5-14600K exhibited a 10.4% boost against its forerunner, the i5-13600K.
Creation PS, LR image editing, DaVinci Resolve image output test
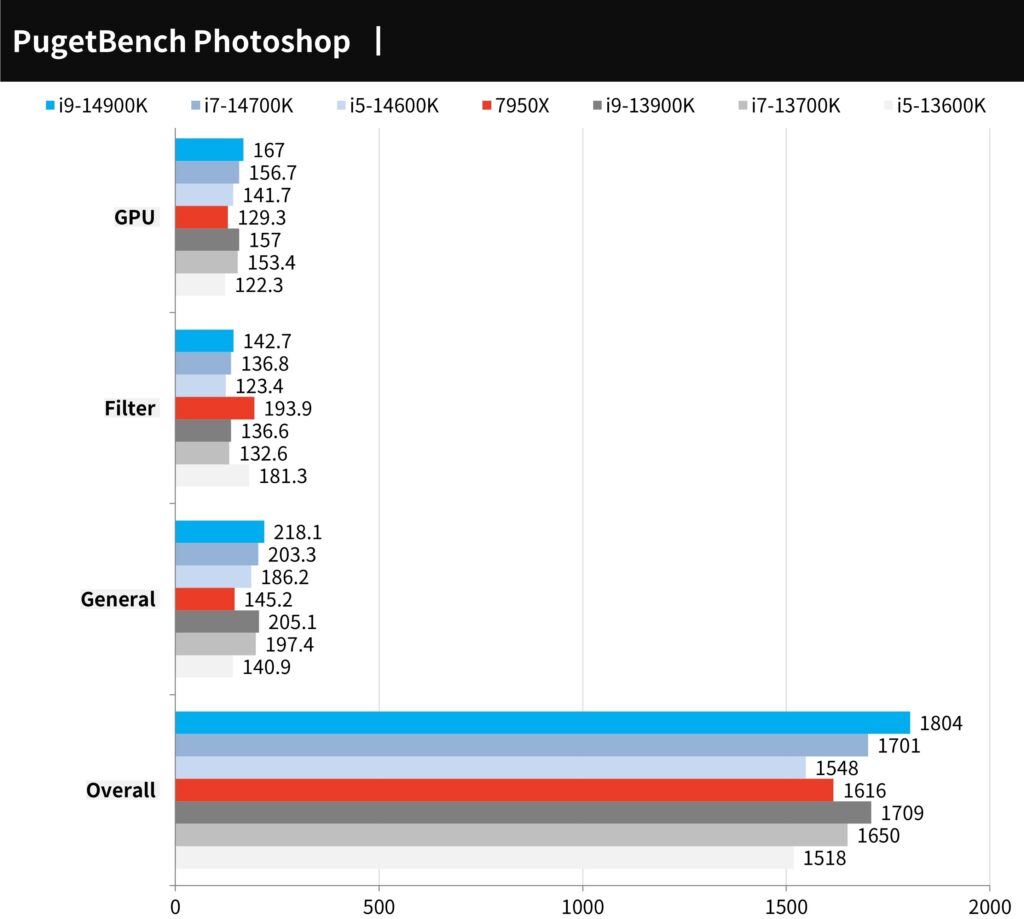
The PugetBench for Photoshop test evaluates the frequently utilized features of Photoshop and is split into two segments: “General” and “Filter”. The “General” segment handles operations on 18MP .CR2 RAW images, including reducing size, rotation, magic wand selection, mask refinement, and more. The “Filter” segment deals with operations like the Camera Raw Filter, lens correction, and noise reduction, among others. The tests are conducted three times, and scores are given out of 1000, with higher scores indicating better performance.
In the performance breakdown:
- The i9-14900K scored 1804 points, reflecting a 6% increase from its predecessor, the i9-13900K.
- The i7-14700K earned 1701 points, marking a 4% boost over the i7-13700K.
- The i5-14600K achieved 1548 points, showing a modest 1% improvement from the i5-13600K.
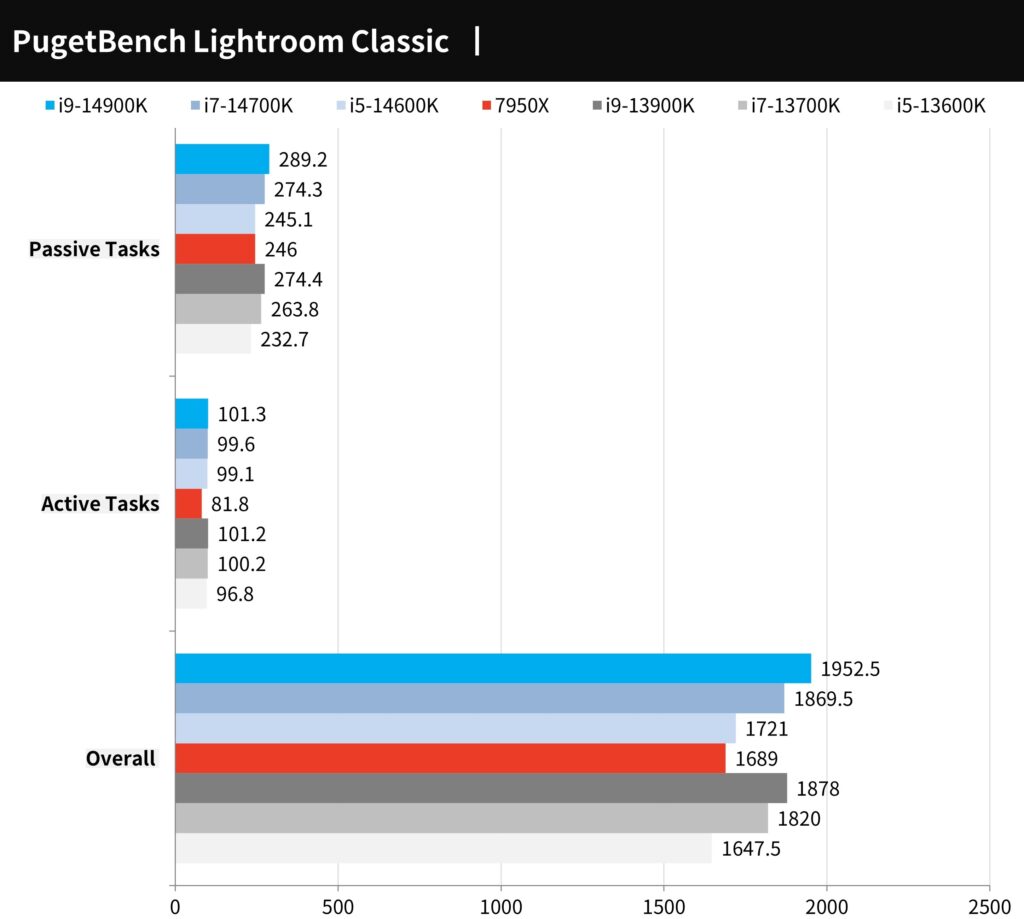
The PugetBench for Lightroom Classic test is designed to assess performance using a library comprised of 500 photographs from cameras like the Canon EOS 5D Mark III, Sony a7r III, and Nikon D850. The active test’s main focus is tasks such as enlarging images, switching views, and auto white balance/tone adjustments in the Lightroom photo library. Meanwhile, the passive test evaluates importing photos, creating smart previews, merging panoramas and HDRs, and exporting in various formats. Scores are out of 1000, with a higher score indicating superior performance.
In the performance metrics:
- The i9-14900K registered a score of 1952.5, marking a 4% increase over the previous i9-13900K.
- The i7-14700K tallied 1869.5 points, a 2.7% boost from its predecessor, the i7-13700K.
- The i5-14600K achieved 1721 points, reflecting a 4% advancement from the earlier i5-13600K.
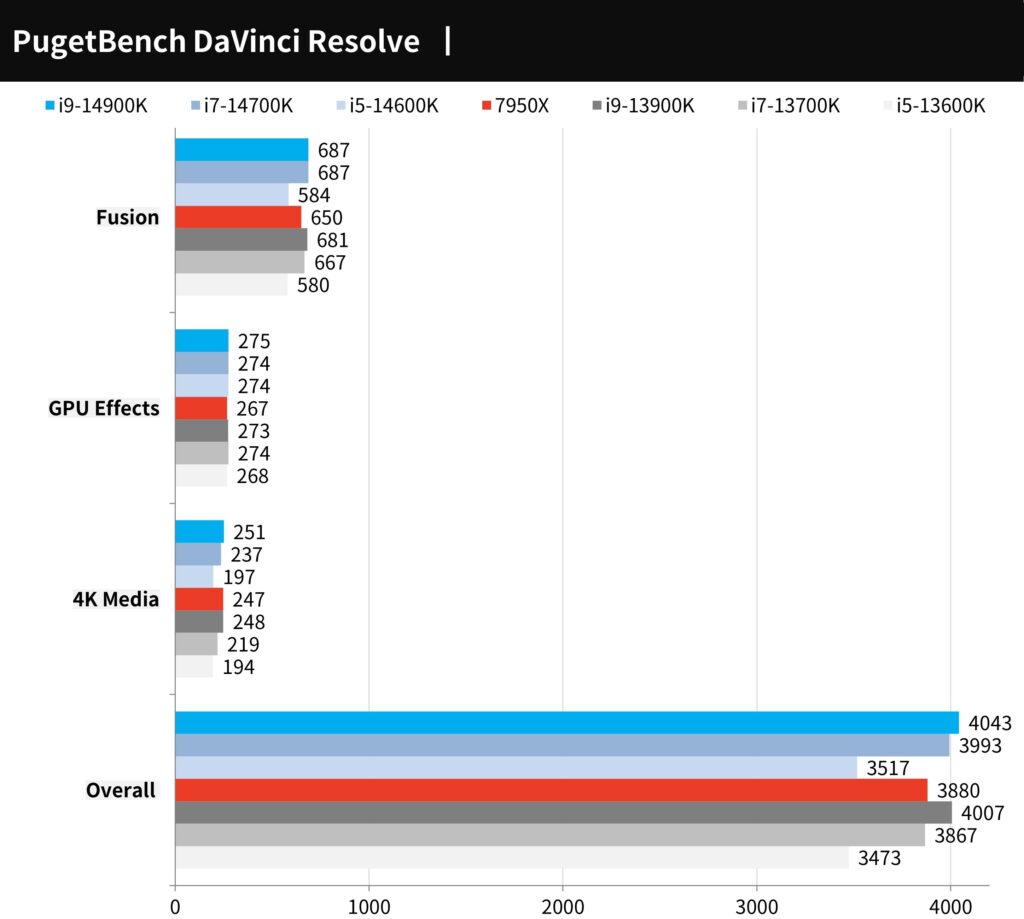
The PugetBench test for DaVinci Resolve evaluates 4K and 8K video performance using various media formats, including 4K H.264, 4K ProRes 422, 4K RED, 8K H.265, and 8K RED. The test also factors in the usage of OpenFX, GPU effects, Fusion, and other special effects to gauge a computer’s video creation capabilities.
Performance results:
- i9-14900K scored 4043 points, reflecting a 1% increase from the preceding i9-13900K.
- i7-14700K achieved 3993 points, marking a 3.3% boost over the i7-13700K.
- i5-14600K registered 3517 points, showing a mere 1% improvement from the i5-13600K.
AIDA64 memory, WinRAR / 7-Zip performance test
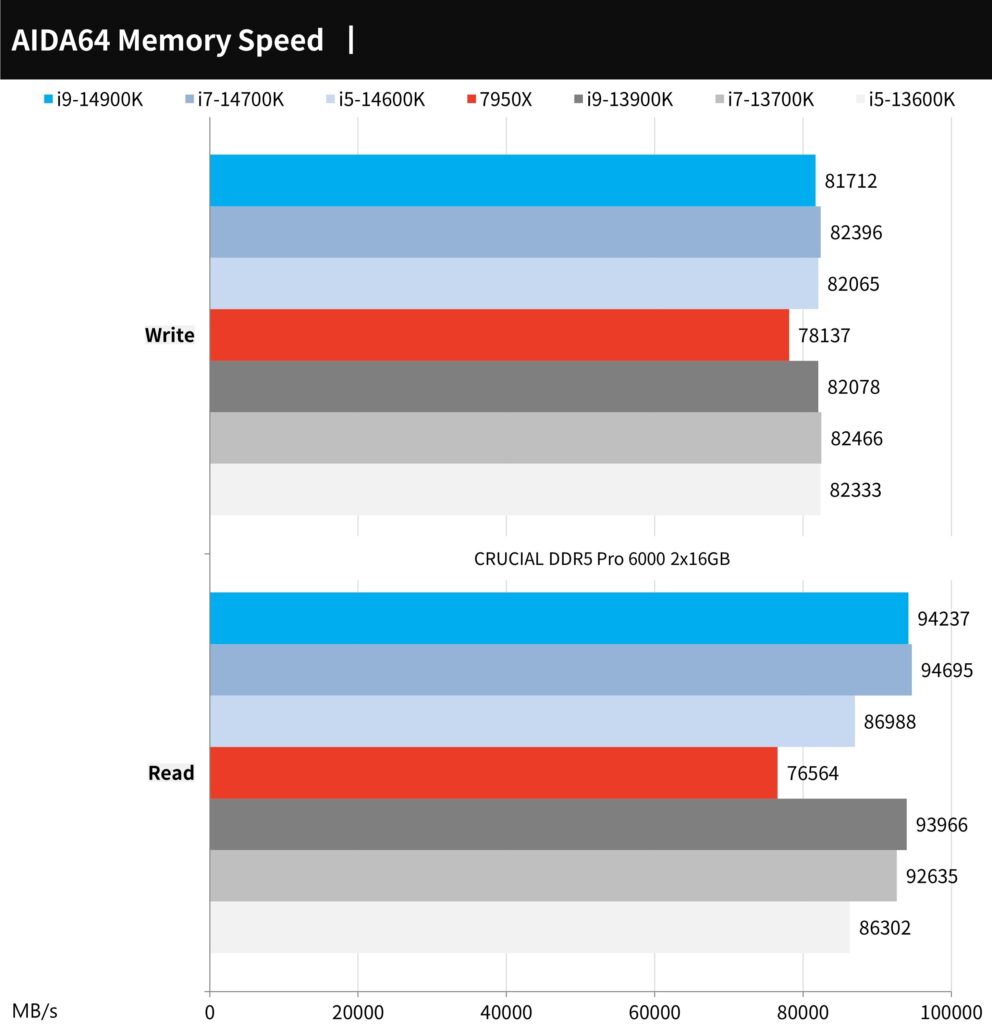
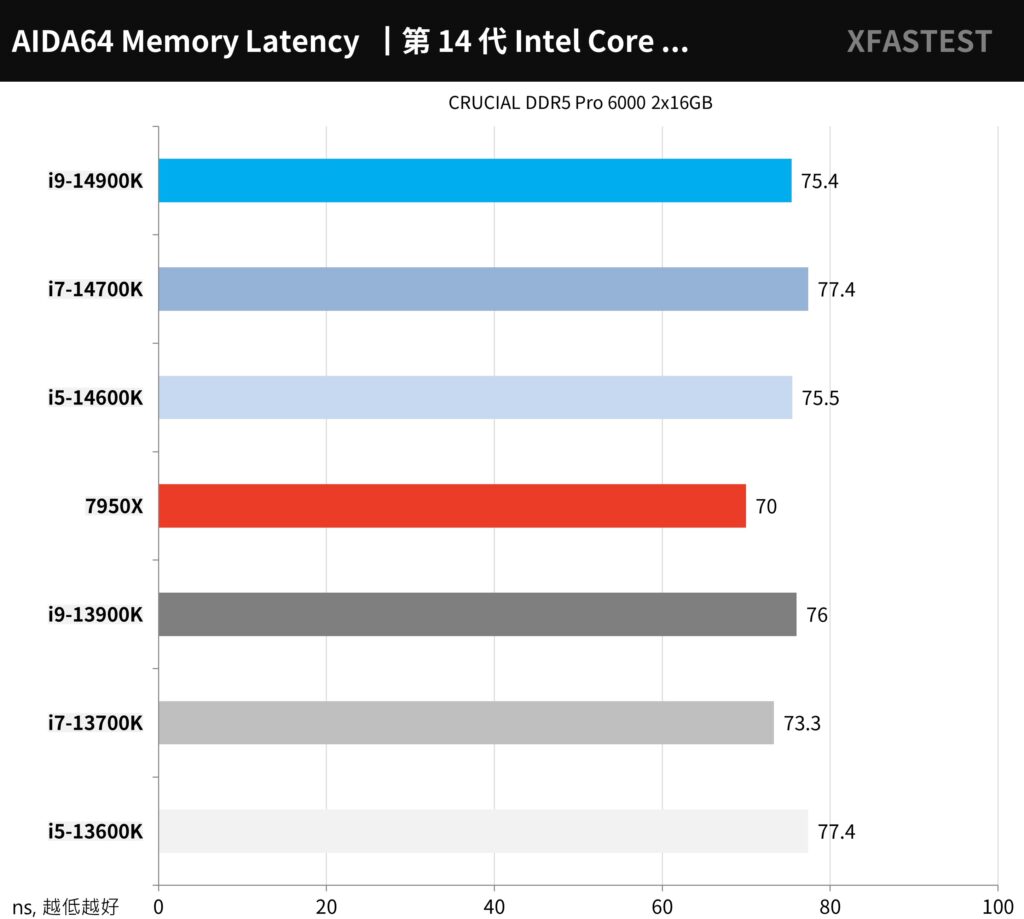
AIDA64 is a popular system information, diagnostics, and benchmarking solution that can evaluate the performance of various components within a system, including the memory.
For the AIDA64 memory test using the CRUCIAL PRO DDR5-6000 16GBx2 configuration:
Intel Core i9-14900K Memory Performance:
- Read Speed: 94,273 MB/s
- Write Speed: 81,712 MB/s
- Latency: 75.4 ns
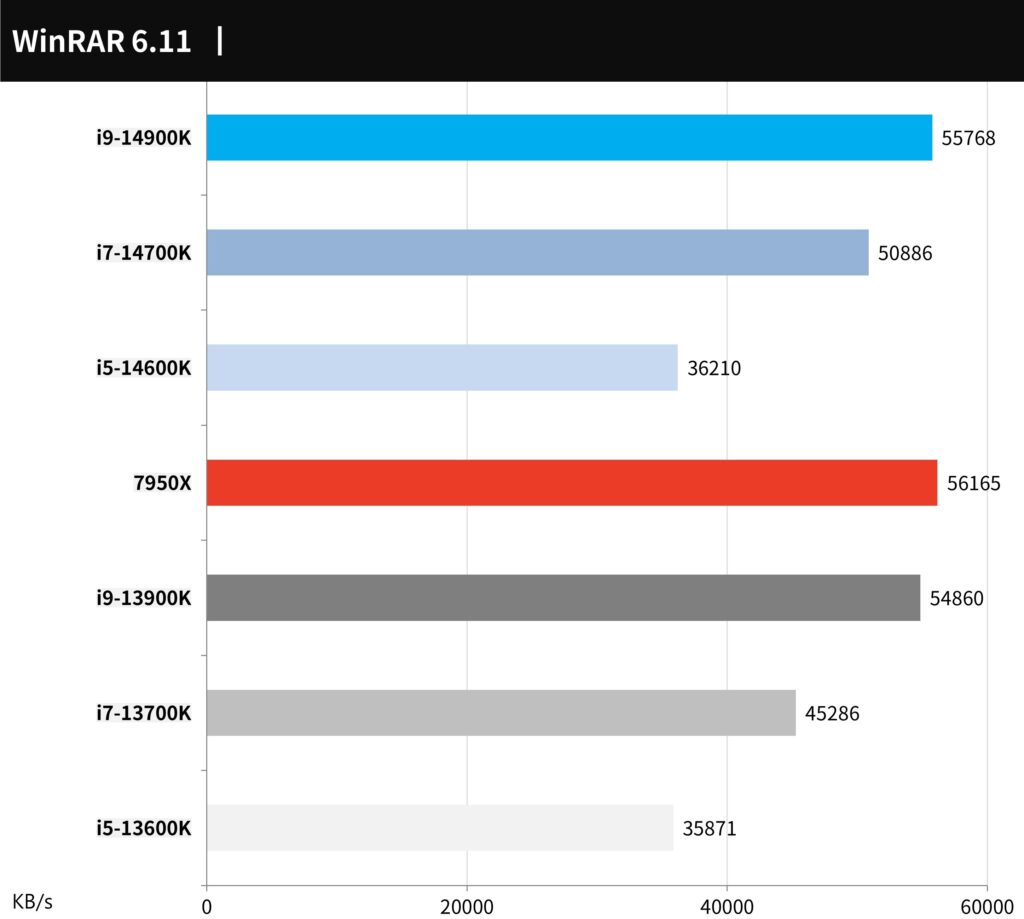
WinRAR is a widely used compression software. The i9-14900K boasts a performance of 55768 KB/s, followed by the i7-14700K at 50886 KB/s, and the i5-14600K at 36210 KB/s. When compared to their predecessors, the i9-14900K shows a modest 2% increase over the i9-13900K. The i7-14700K exhibits a notable 12.4% jump from the i7-13700K. Meanwhile, the i5-14600K only sees a slight 1% boost when compared to the i5-13600K.
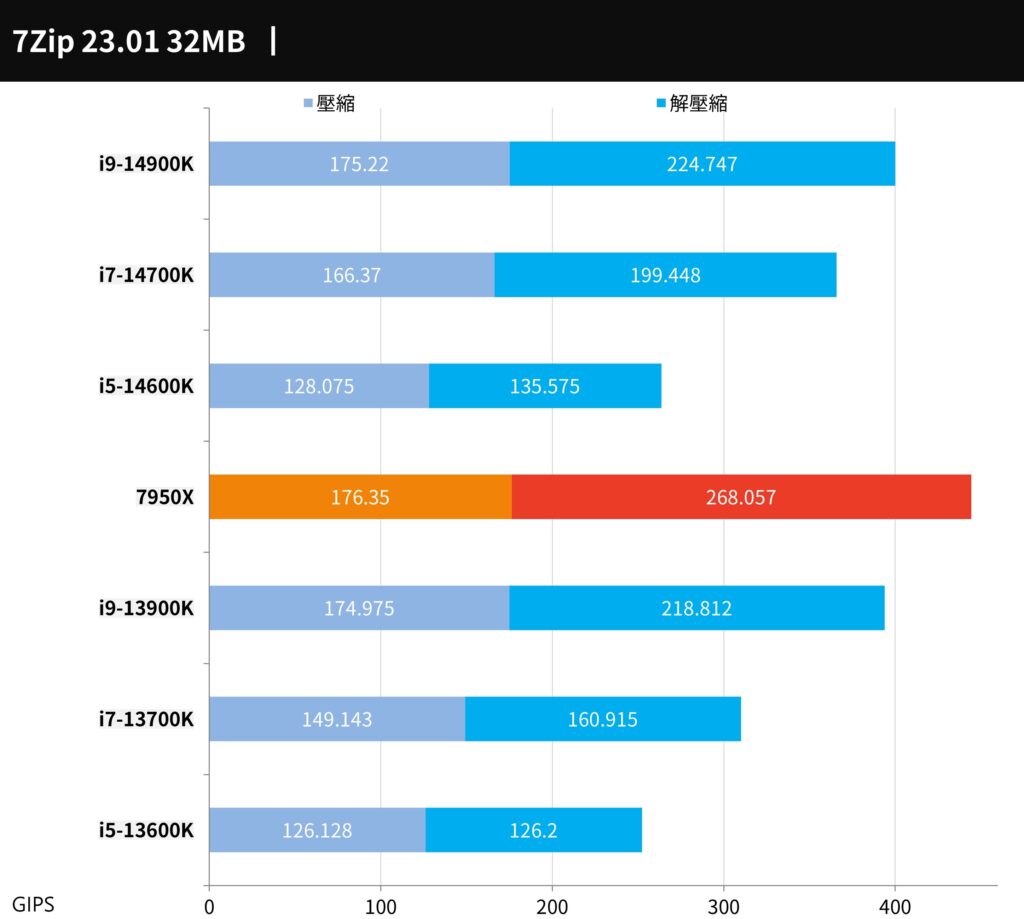
7-Zip, a widely recognized free compression software, excels in leveraging multi-core capabilities. When assessing performance, the i9-14900K delivers 175.22 / 224.747 GIPS, the i7-14700K achieves 166.37 / 199.448 GIPS, and the i5-14600K stands at 128.075 / 135.575 GIPS. In a generational comparison, the i9-14900K surpasses its predecessor, the i9-13900K, by 1%; the i7-14700K outperforms the i7-13700K by a significant 17.7%; and the i5-14600K sees a 4% enhancement over the i5-13600K.
PCMark 10, CrossMark Computer Performance Test
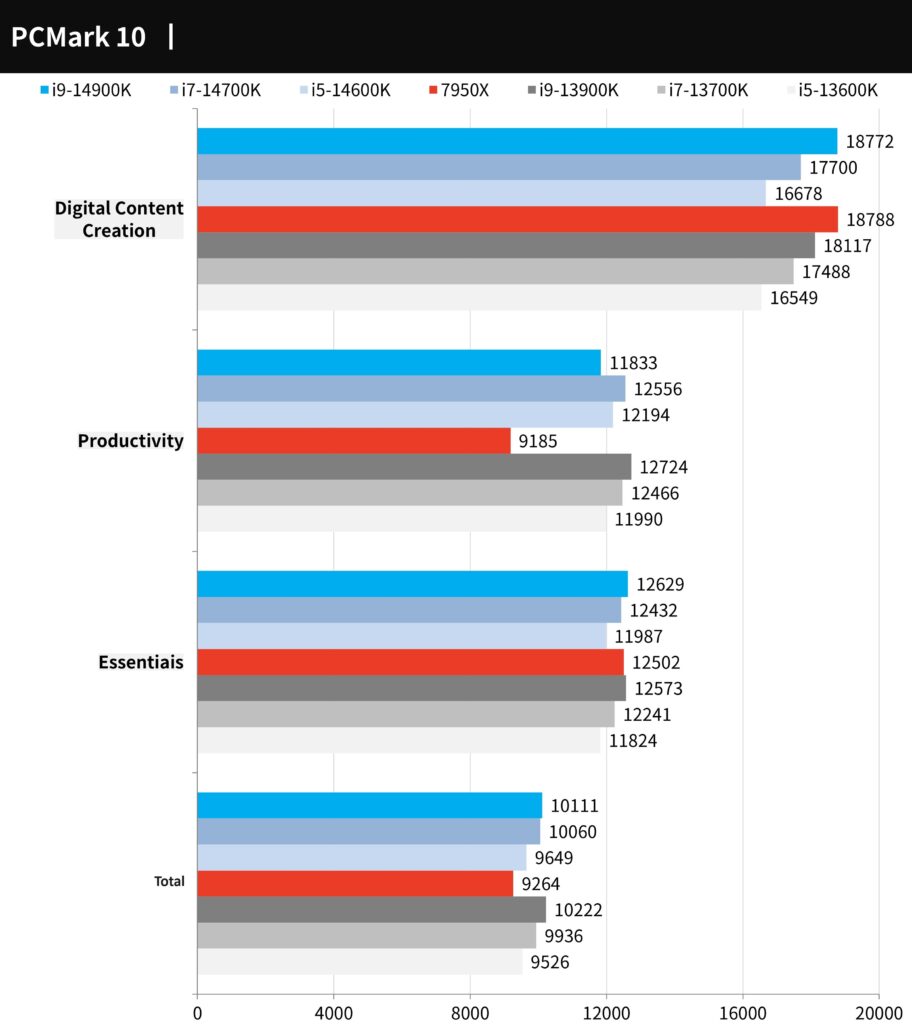
PCMark 10 was utilized to gauge the comprehensive performance of the computer. This tool provides scores for fundamental computer tasks in the “Essentials” category, such as the speed of app startups, video conferencing quality, and web browsing efficiency. The “Productivity” test focuses on tasks related to spreadsheets and document processing, while the “Digital Content Creation” assessment measures capabilities in areas like photo/video editing, rendering, and visualization.
In the scoring:
- i9-14900K achieved 10111 points,
- i7-14700K registered 10060 points,
- i5-14600K scored 9649 points.
When compared to their respective predecessors:
- i9-14900K showed a decrease in performance by 1% relative to the i9-13900K,
- i7-14700K exhibited a 1.2% improvement over the i7-13700K,
- i5-14600K indicated a modest 1% boost against the i5-13600K.
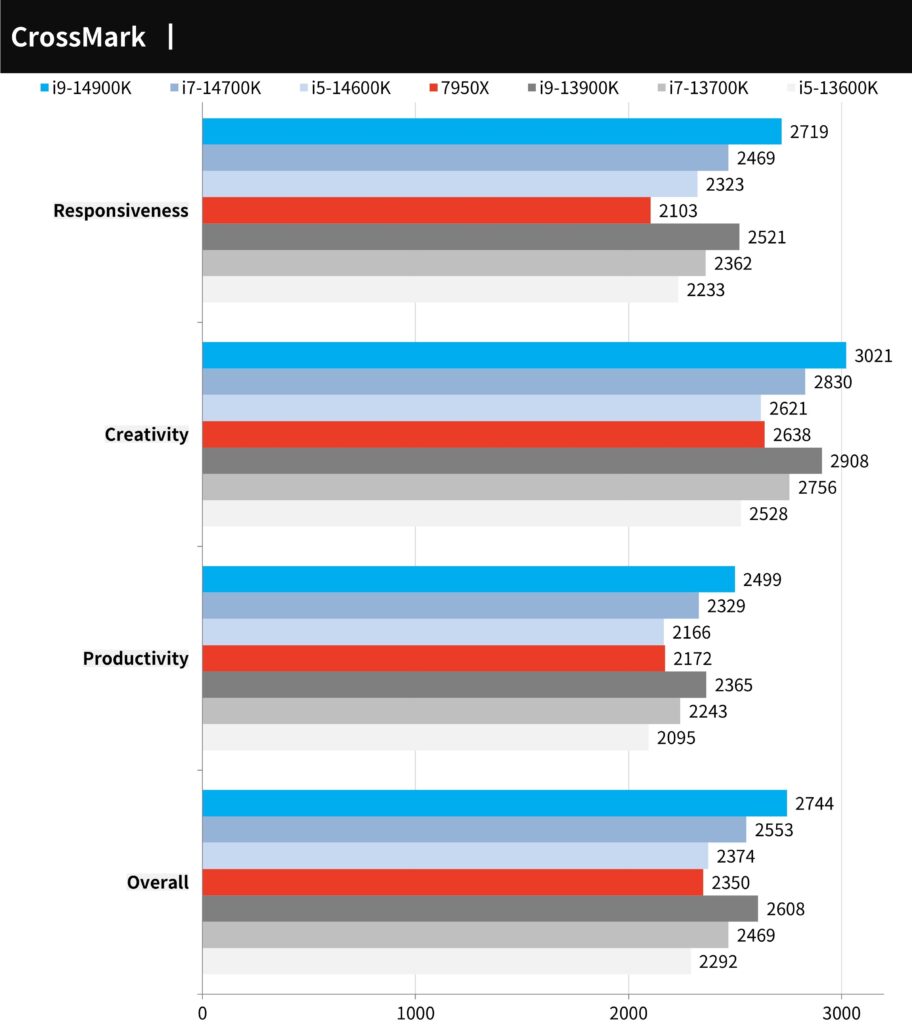
CrossMark, crafted by BAPCo, is a free, cross-platform tool designed to test computer performance. It’s compatible with a wide range of platforms, including Windows, iOS/iPadOS, macOS, and Android. The tool zeroes in on general productivity tasks like text editing, spreadsheet work, and web browsing. Additionally, it delves into creative realms by testing photo editing, organization, and video editing capabilities. The tool also evaluates the response speed of computers.
Here’s a breakdown of the scores from the test:
- i9-14900K came in at 2744 points,
- i7-14700K scored 2553 points,
- i5-14600K recorded 2374 points.
When we juxtapose these results with their previous generation counterparts:
- i9-14900K showcases a 5% performance uptick over the i9-13900K,
- i7-14700K marks a 3.4% surge from the i7-13700K,
- i5-14600K observes a 4% enhancement relative to the i5-13600K.
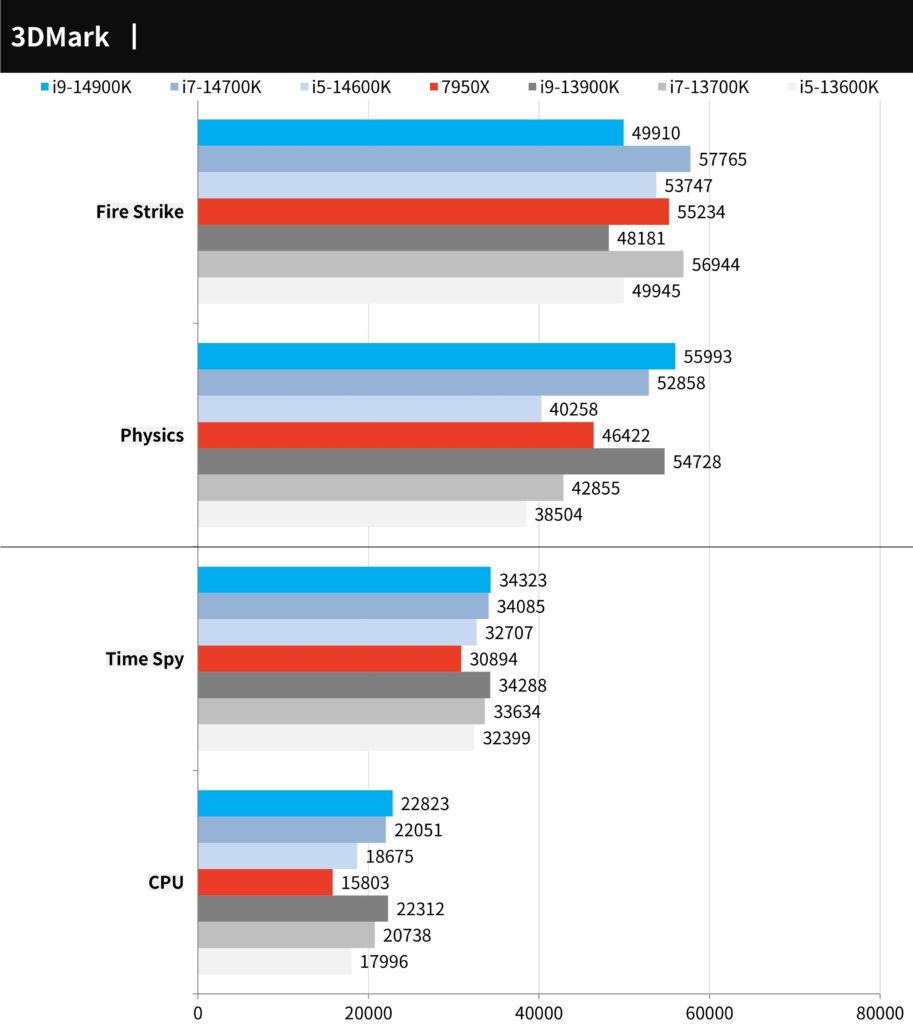
3DMark CPU performance and Fire Strike, Time Spy benchmark tests
3DMark, a widely recognized tool for testing game graphics performance, employs mainstream tests such as the Direct X11’s Fire Strike and Direct X12’s Time Spy.
Here’s a breakdown of the results:
Fire Strike Physics Test:
- i9-14900K: 55993 points,
- i7-14700K: 52858 points,
- i5-14600K: 40258 points.
Time Spy CPU Test:
- i9-14900K: 22823 points,
- i7-14700K: 22051 points,
- i5-14600K: 18675 points.
When compared against their previous generation:
- i9-14900K exhibits a 2% performance increase in game physics over the i9-13900K.
- i7-14700K demonstrates a significant 14.8% performance boost compared to the i7-13700K.
- i5-14600K shows a 4% improvement in performance relative to the i5-13600K.
The 3DMark CPU test evaluates the processor’s capabilities by focusing on its physical operations and tailored simulation tasks. It tests performance across varying thread counts: 1, 2, 4, 8, 16, and the CPU’s maximum threads. Any performance exceeding 16 threads is utilized exclusively for 3D rendering as well as audio and video output. Generally, modern Direct X12 games favor 8-thread (8T) execution, while older games tend to prefer fewer threads.
Here’s a summary of the performance results:
- For the 1-thread to 4-thread (1T-4T) test range, the i9-13900K outperformed the rest.
- In the 8T test, the i9-14900K took the lead with a score of 9204 points.
- However, in the 16T category, the 7950X came out on top, surpassing other competitors.
- For the maximum execution thread test, the i9-14900K clinched the top spot with a score of 17290 points.
This demonstrates the varied strengths of different CPUs depending on the number of threads being utilized.
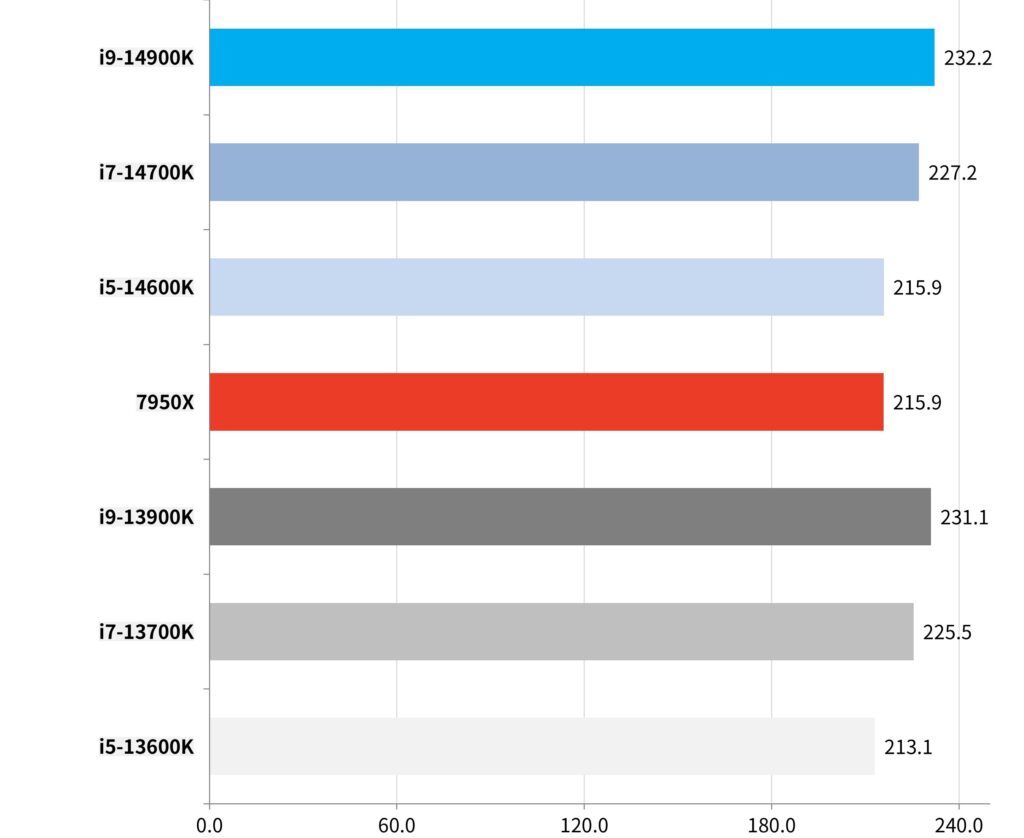
9+2 AAA e-sports games processor performance test
Performance tests were run on 9 AAA game titles, encompassing a range from entry-level racers like “F1® 22” to action-packed adventures like “Tomb Raider: Shadow of the Tomb Raider” and “Horizon: Dawn of Dawn”. High-performance demanding titles, “Edge 3” and “Red Dead Redemption 2”, were also tested alongside “Assassin’s Creed: Viking Age”. Furthermore, ray tracing-supported games like “Trench 6”, “Marvel’s Assault Squad”, and the renowned “Cyberpunk 2077” were also included in the lineup.
Each game was evaluated using its In Game Benchmark test at a resolution of 1080p, with settings cranked up to the maximum default.
Breaking down the results:
- i9-14900K led with an average frame rate of 232.2 FPS.
- i7-14700K followed closely with an average of 227.2 FPS.
- i5-14600K delivered an average of 215.9 FPS.
In a generational showdown:
- i9-14900K showed a modest 1% performance boost over the i9-13900K.
- i7-14700K inched ahead by 0.8% compared to the i7-13700K.
- i5-14600K matched the trend with a 1% improvement over the i5-13600K.
In summary: Not bad at all.
E-sports games prioritize the competitive nature between players and teams, emphasizing tactics and skills over heavy graphical demands. As a result, they tend to offer superior FPS performance on high-end CPUs and GPUs, especially when played at 1080p resolution. As the resolution scales up, enhancements in CPU performance and clock speed can amplify the game’s FPS yield.
In this test, two renowned e-sports titles were selected: “Counter-Strike 2” (CS2) and “Tom Clancy’s Rainbow Six: Siege” (R6). Both games were tested at 1080p resolution, leveraging the highest in-game settings.
Here’s a snapshot of the results:
i9-14900K:
- CS2: Averaged at a towering 370 FPS.
- R6: Peaked at an impressive average of 687 FPS.
i7-14700K:
- CS2: Achieved an average of 357 FPS.
- R6: Recorded an average of 641 FPS.
i5-14600K:
- CS2: Managed an average of 343 FPS.
- R6: Secured an average of 528 FPS.
These results underline the exceptional performance these CPUs can deliver in e-sports games, ensuring smooth and responsive gameplay for competitive players.
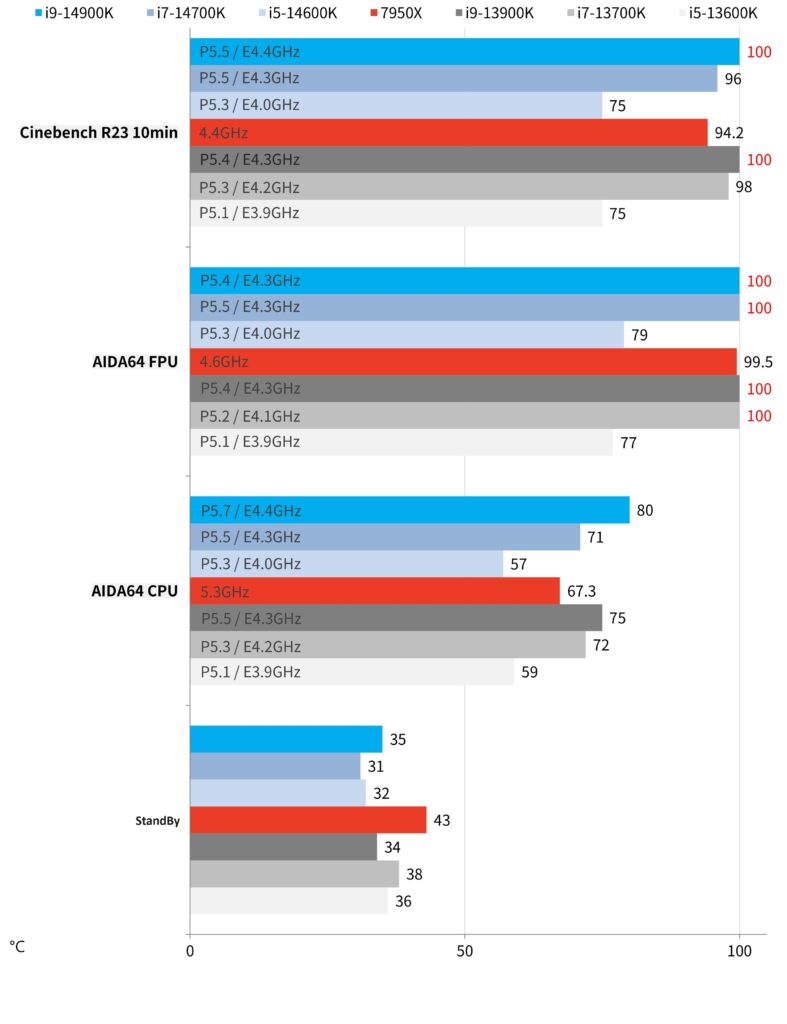
i9-14900K, i7-14700K, i5-14600K processor temperature and power consumption test
When it comes to stress testing, employing a 360mm AIO (All-In-One liquid cooler) with both the fan and the water pump set to their maximum speeds provides a rigorous test environment. AIDA64 CPU, FPU (Floating Point Unit), and Cinebench R23 were used for the burn-in tests. For everyday computing tasks, temperatures achieved during the AIDA64 CPU test are more representative, while the FPU test simulates the highest load and increased power consumption conditions.
Here’s a summary of the temperature results under the AIDA64 CPU stress test:
i9-14900K:
- All-core clock speeds: P5.7 GHz (Performance mode) / E4.4 GHz (Efficiency mode)
- Resultant temperature: 80°C
i7-14700K:
- All-core clock speeds: P5.5 GHz / E4.3 GHz
- Resultant temperature: 71°C
i5-14600K:
- All-core clock speeds: P5.3 GHz / E4.0 GHz
- Resultant temperature: 57°C
In more extreme stress tests using FPU and Cinebench R23, all processors touched the thermal power consumption ceiling of 100°C.
It’s worth noting that the thermal dissipation performance of this generation mirrors that of the preceding generation. This is because both generations share the same architectural design and manufacturing process. The results emphasize the importance of proper cooling solutions, especially when pushing the CPUs to their performance limits.
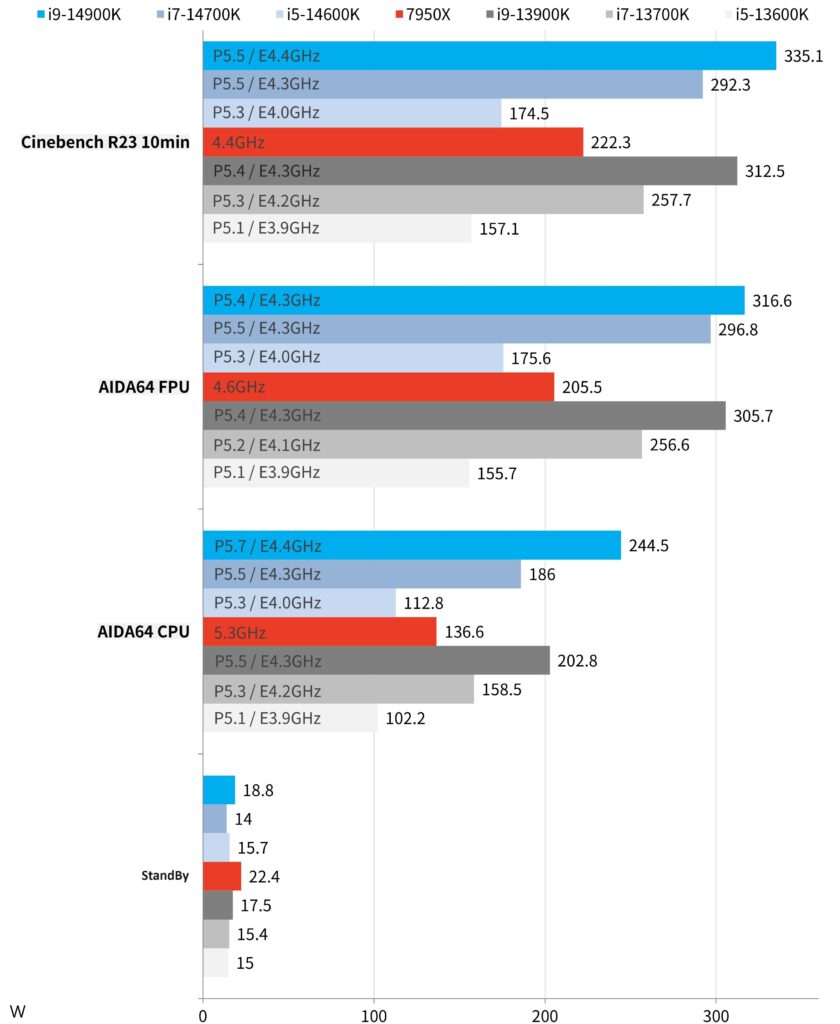
When considering the power consumption of a CPU, the CPU Package Power is a principal metric. For the i9-14900K, i7-14700K, and i5-14600K, it’s evident that they generally consume more power compared to their predecessors. However, as previously detailed, the performance gains over the previous generation aren’t substantial.
This observation indicates a potential diminishing return on power consumption for the marginal performance gains. For users focusing on energy efficiency or aiming to maintain a cooler system, this might be a significant factor to consider. Conversely, for those prioritizing absolute performance, the increased power draw might be a reasonable trade-off.
Summarize
The latest i9-14900K offers a modest performance improvement — around 3% in actual tests, even though a 5% gain was anticipated. The i7-14700K could potentially offer up to 18% better multi-core performance at a similar price point, but it doesn’t shine in creative tasks, overall computing, or gaming. The i5-14600K disappoints with a mere 1% boost across multiple tests.
While the 14th generation Intel Core is priced similarly to its predecessor in USD, the actual cost might be slightly higher due to the continued availability of the 13th generation and varying exchange rates. For those building a new PC, it might be more worthwhile to opt for the 13th generation Intel Core processor, especially when paired with the 600, 700 series or the latest Z790 motherboards. This would enable users to harness the significant upgrade that this generation brings: Wi-Fi 7.
For those considering an upgrade, it might be wise to hold off. The anticipated departure from the “Core i” branding in the next Intel generation and the introduction of the potential “Core Ultra” might deliver a more substantial performance boost. A gentle nudge to AMD Ryzen: Please keep pushing the boundaries. If not, Intel might revert to its incremental “toothpaste squeezing” approach.
If this article is helpful for you, please share this article with your friends on social media. Thank you!
This article is based on the personality of the reviews. You are responsible for fact-checking if the contents are not facts or accurate.
Title: Intel’s 14th Generation Core K Series: An In-Depth Review and Performance Analysis Against Ryzen and Previous Generations