AMD Ryzen 7000 processors will be the generation with the most significant clock leap in history. Bringing 13% IPC improvement from AMD Zen 4 architecture, the first 5nm process core, 6nm I/O Die and AM5 new platform, allowing the flagship Ryzen 9 7950X to reach a single-core 5.7GHz Boost clock and an all-core 5.0GHz or more Ryzen 7950X and 7600X will be the first to be released in the first wave of performance overclocking. Can this generation compete with its opponents or even become the most potent gaming processor ahead of time?
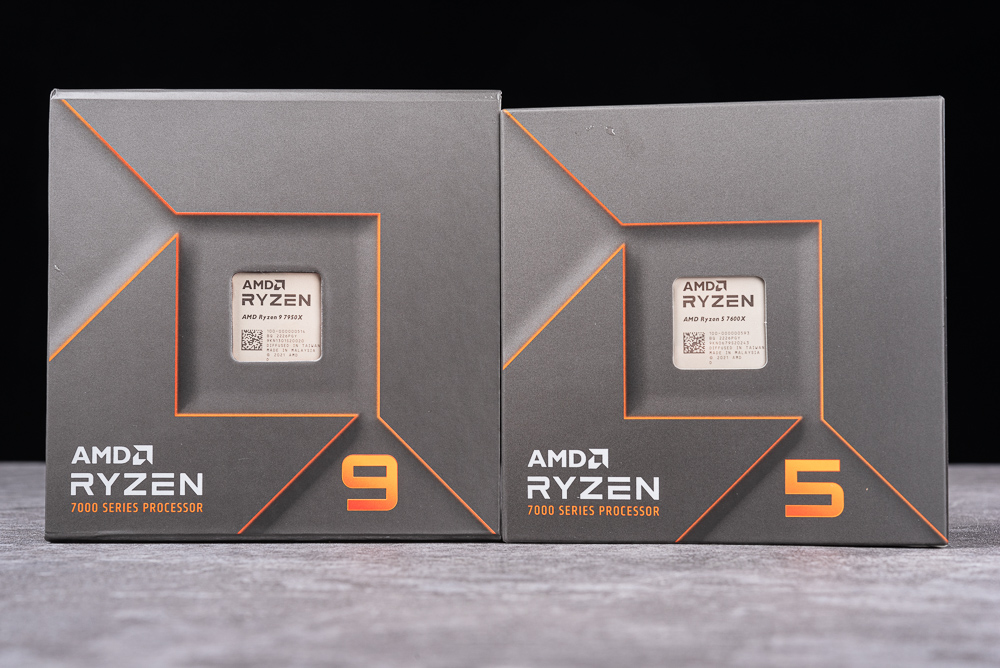
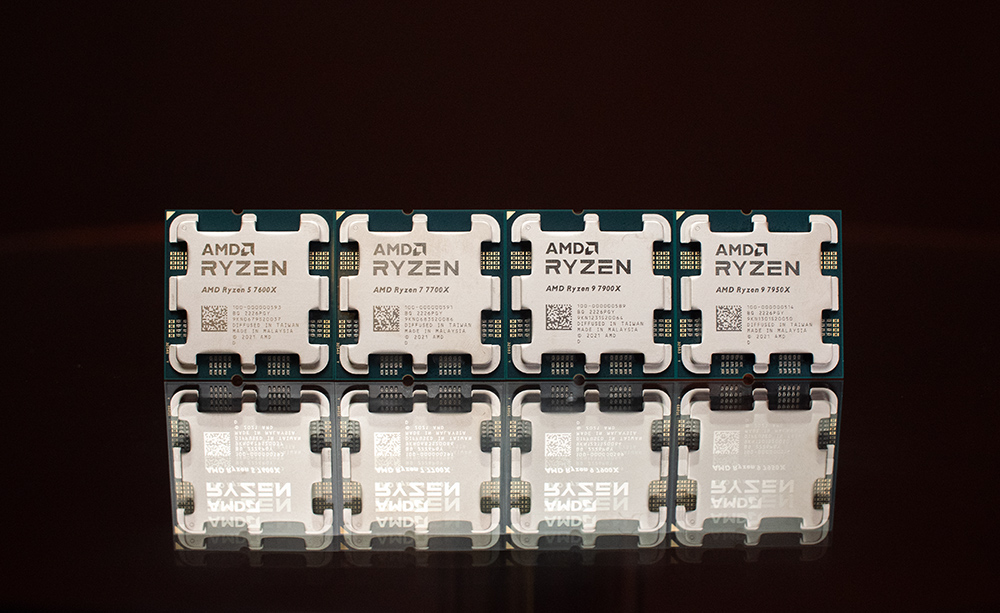
The first 4 Ryzen 7000 series processors: 7950X, 7900X, 7700X, 7600X
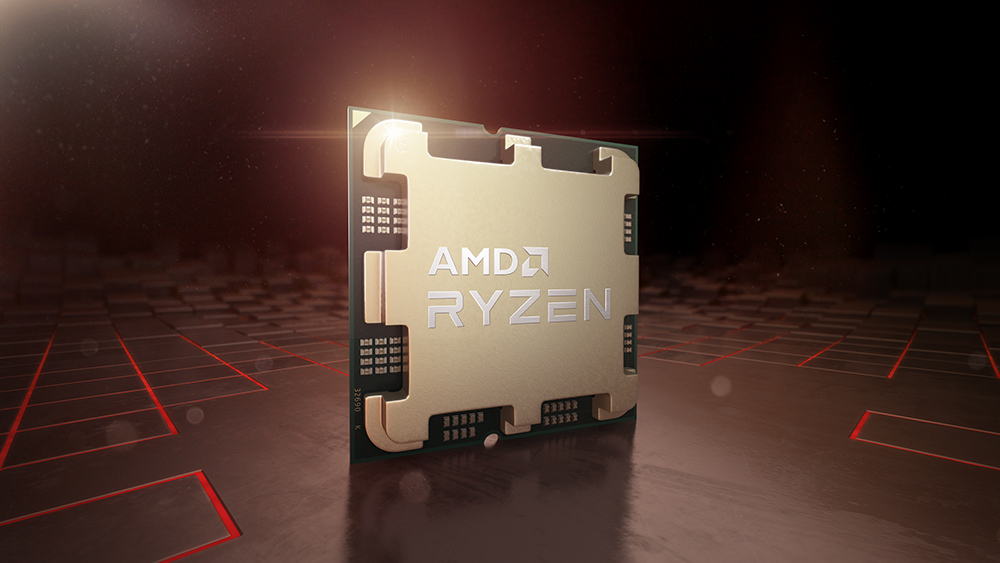
For AMD: “Ryzen 7000 is undoubtedly the beginning of a new era, the most familiar Ryzen but a new high clock performance experience.”
The Ryzen 7000 series processor core is upgraded to Zen 4 architecture and TSMC 5nm process, achieving a 13% IPC performance improvement and a 29% single-core performance upgrade. And also includes new specifications such as PCIe 5.0 and DDR5, as well as new AM5, LGA1718 pins and X670E new platform.
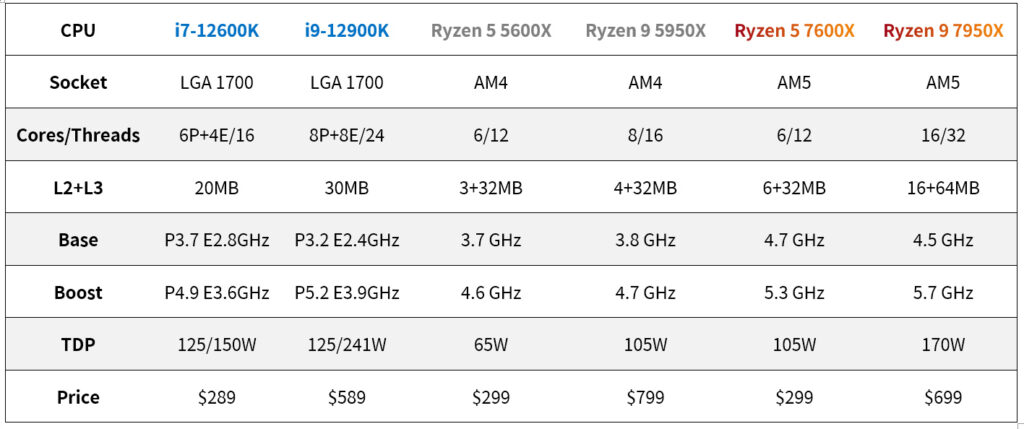
This generation of processors will have an average default clock of 4.5GHz and a larger L2 cache. The starting lineup will be the flagship 16-core 32-thread Ryzen 9 7950X, the high-end 12C24T Ryzen 9 7900X, the mainstream 8C16T Ryzen 7 4 processors, including 7700X and entry-level 6C12T Ryzen 5 7600X will be officially sold at 21:00 pm on 9/27.
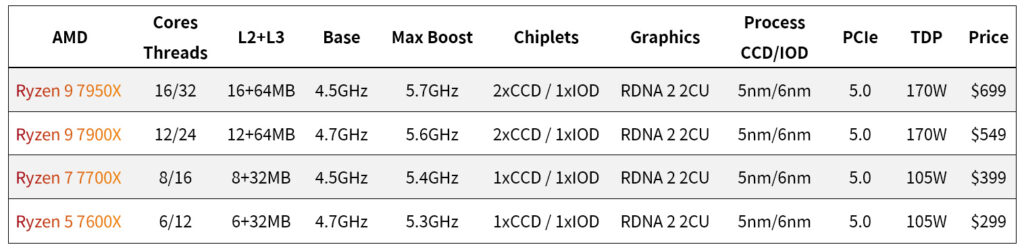
Ryzen 9 7950X and 7900X are high-performance processors with 170W TDP, with a base clock of 4.7GHz and a boost clock of up to 5.7-5.6GHz; while Ryzen 7700X and 7600X are 105W TDP, and the watches of both are slightly different. Adjustment, Boost is up to 5.3-5.4GHz.
In addition, the price of the 7950X is US$699, which is US$100 cheaper than the previous generation, 5950X, while the cost of the 7900X remains the same at US$549. As for the mainstream 7700X, the price is also lower by US$399, which may be to keep the price band. For the future 7800X or 7800X 3D, as for the 7600X, it’s set at $299.
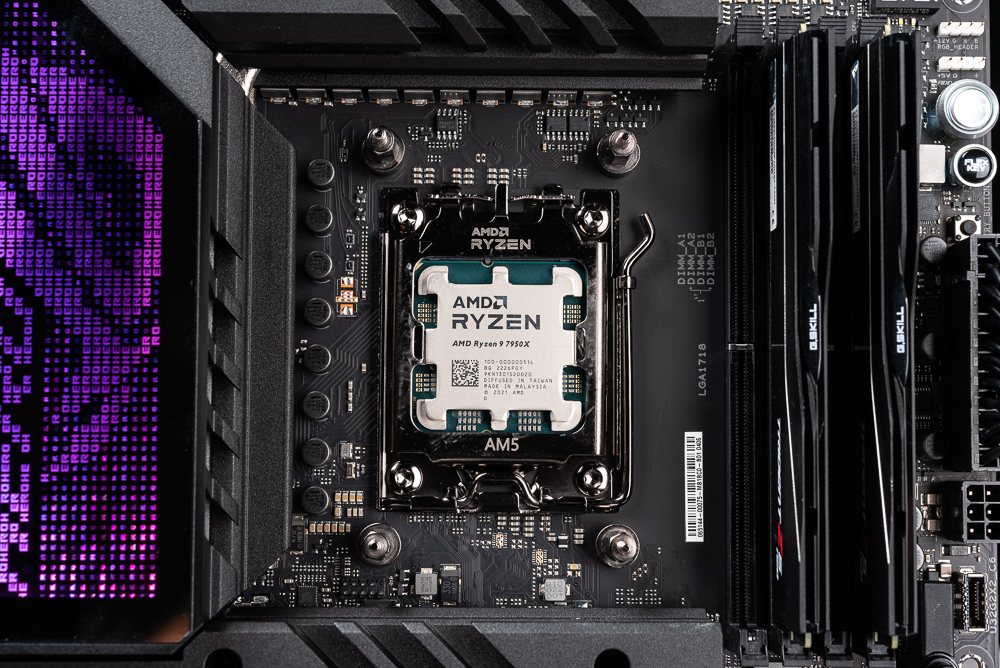
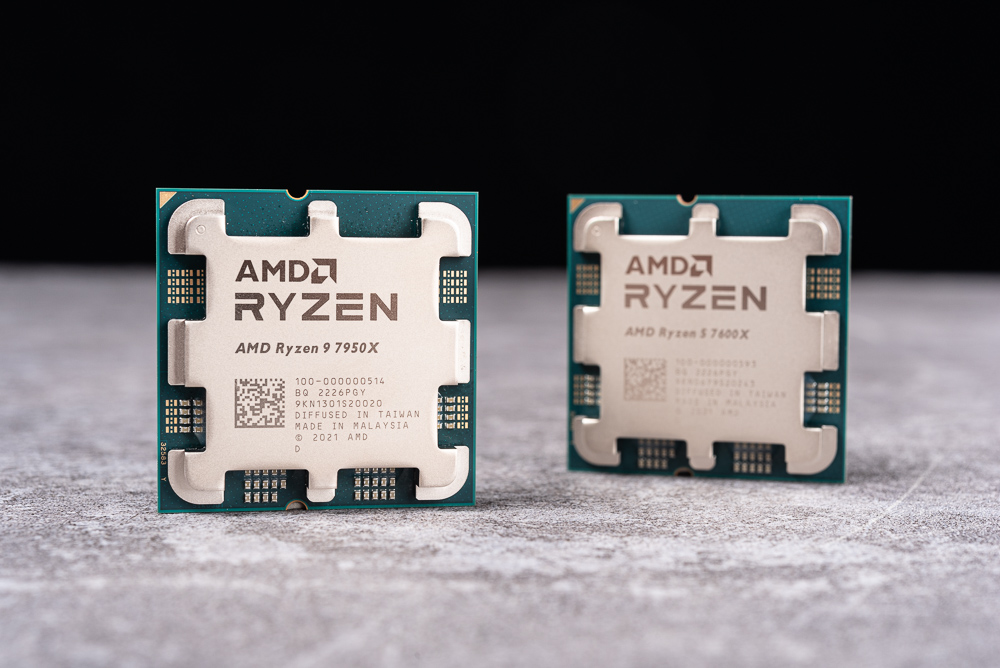
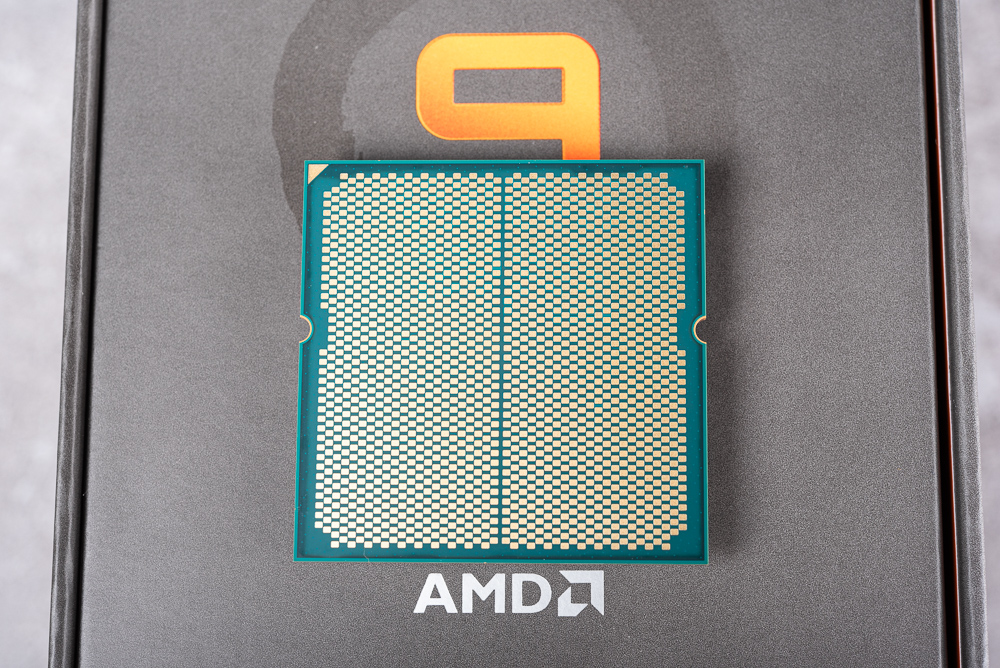
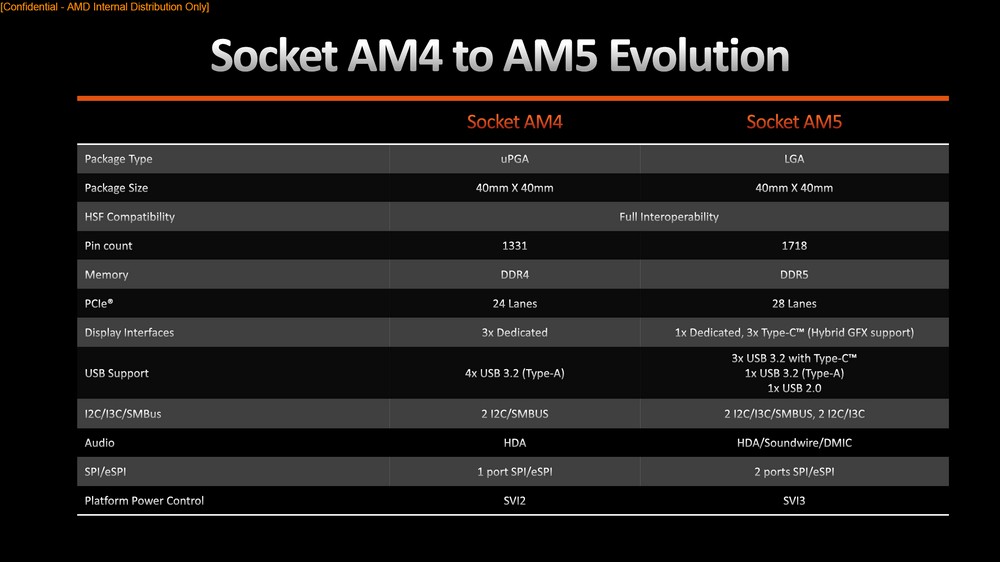
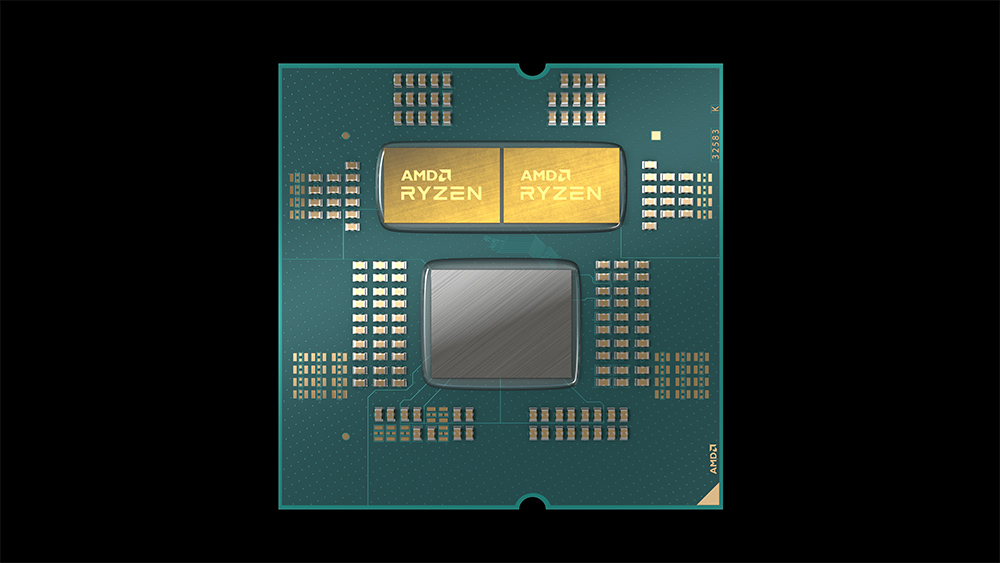
The processor in this generation of AM5 package maintains the same area of 40 x 40mm as AM4, the CPU HIS heat dissipation top cover adopts a unique eight-claw shape, the capacitors are set on the front of the substrate, and the height of the top cover is also the same as that of AM4. Therefore, the radiator of the original AM4 can be used.
After changing to the AM5 pin, in addition to providing a larger power supply wattage and I/O for the CPU, the more important thing is that DIY players will not find that the processor is missing after removing the radiator, and it ends up sticking on the radiator. The embarrassing situation of denting the pins is also not careful, and AMD expects the AM5 pins to be used at least 2025 or more.
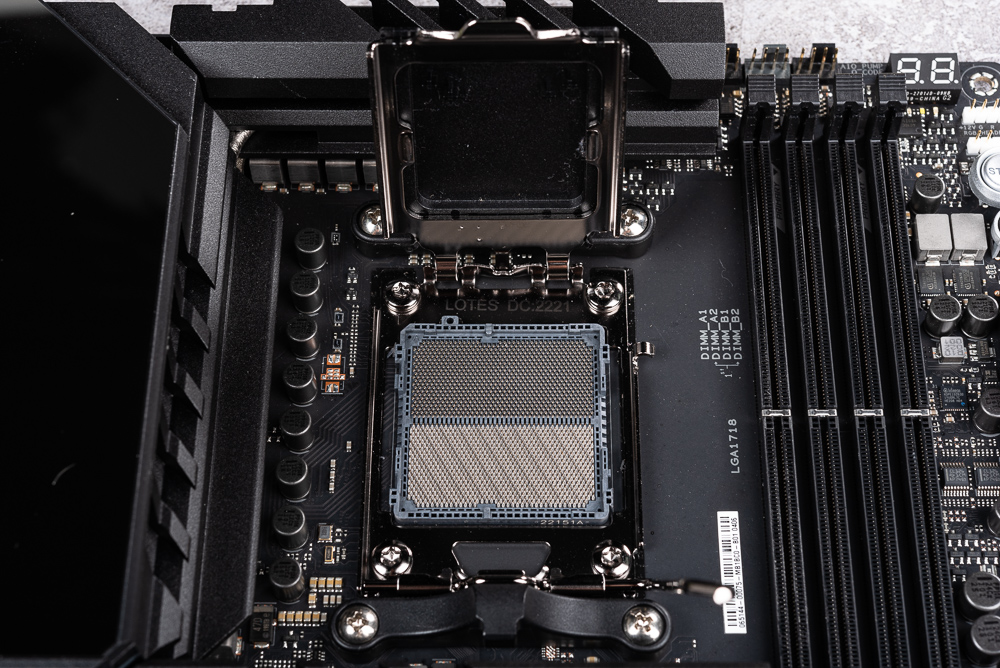
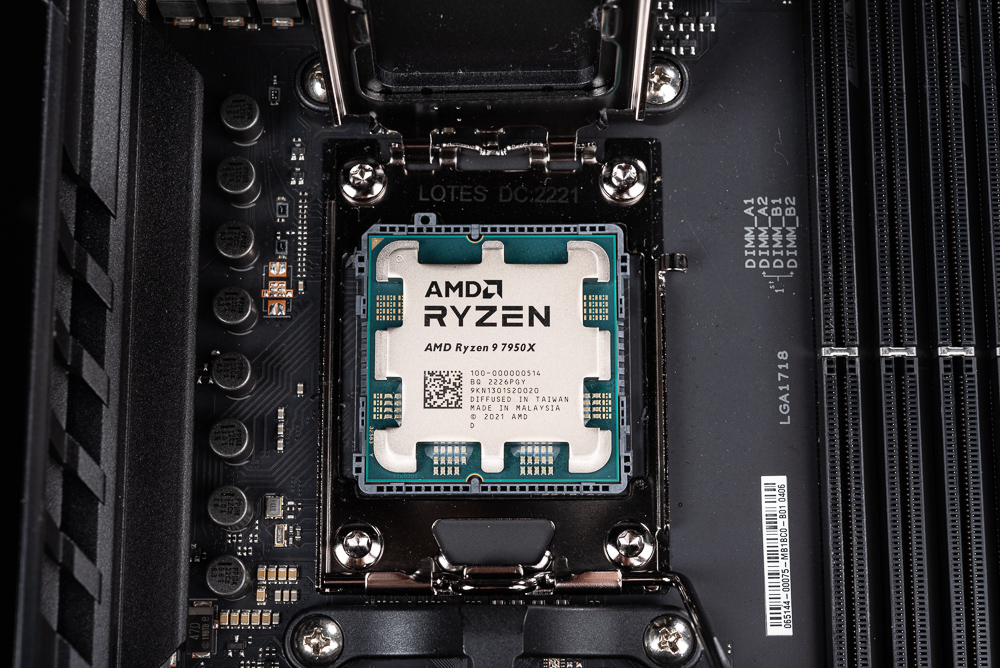
The processor installation is similar to Intel. First, open the lever of the motherboard (press down the lever and then turn to the right) to open the fastener. At this time, you can first check whether the motherboard’s pins are consistent and then hold it firmly in the direction of the formal installation. Put the processor into the socket, and pay attention to whether the foolproof notch is aligned with the socket.
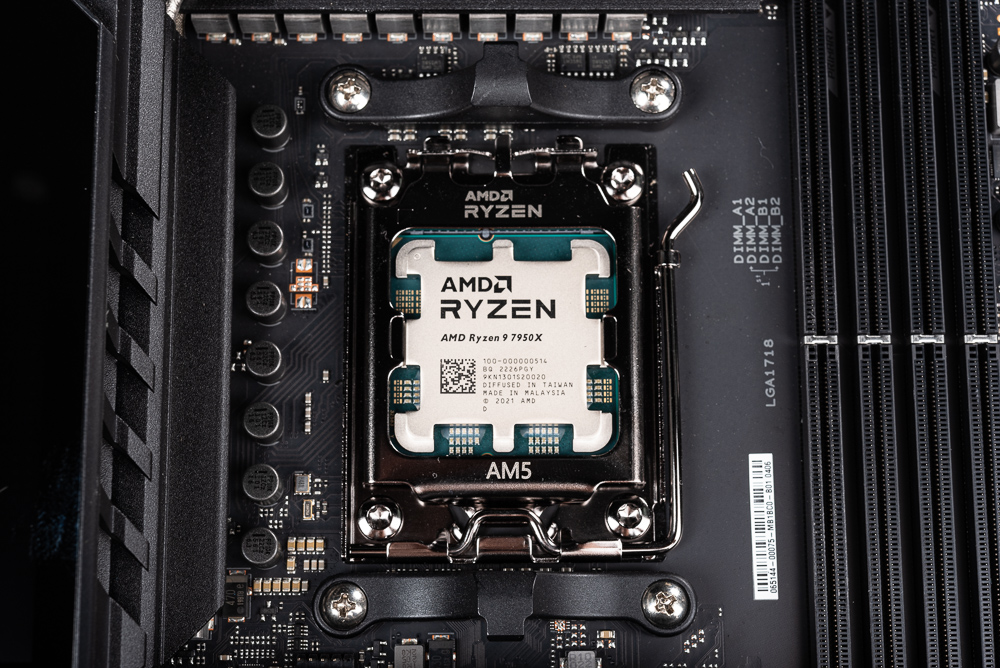
After the processor is placed in the socket and aligned, the fastener can be snapped back, and the lever can be pressed down to complete the installation.
13% IPC boosted Zen 4 architecture upgrade with AVX-512 directives
This generation of Ryzen 7000 processors brings players not only a 13% increase in IPC but also the first full-core high clock performance above 5.0GHz. This generation of AMD relaxes the power consumption limit under the advantage of a high clock. Fight the multi-core advantage brought by Intel’s hybrid core architecture.
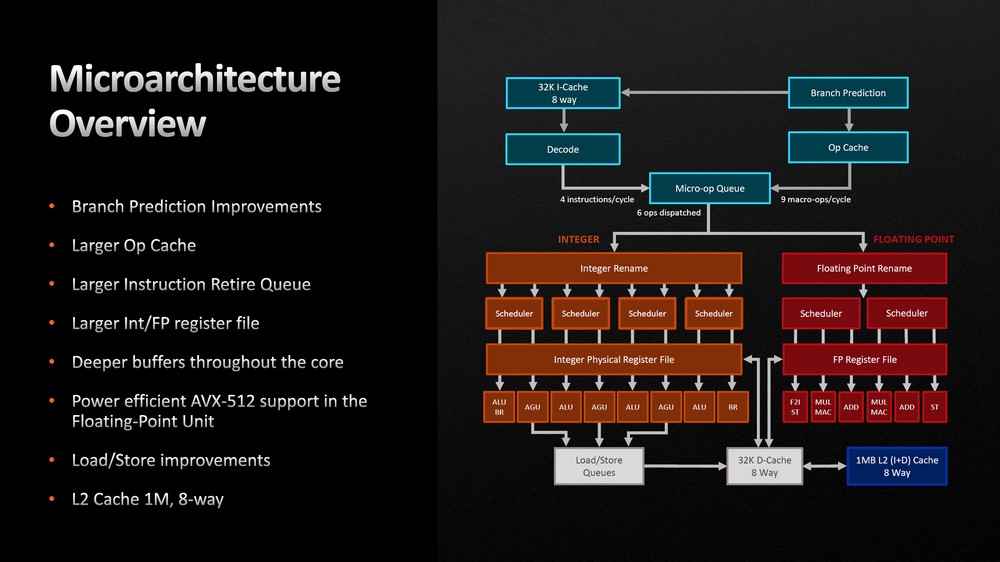
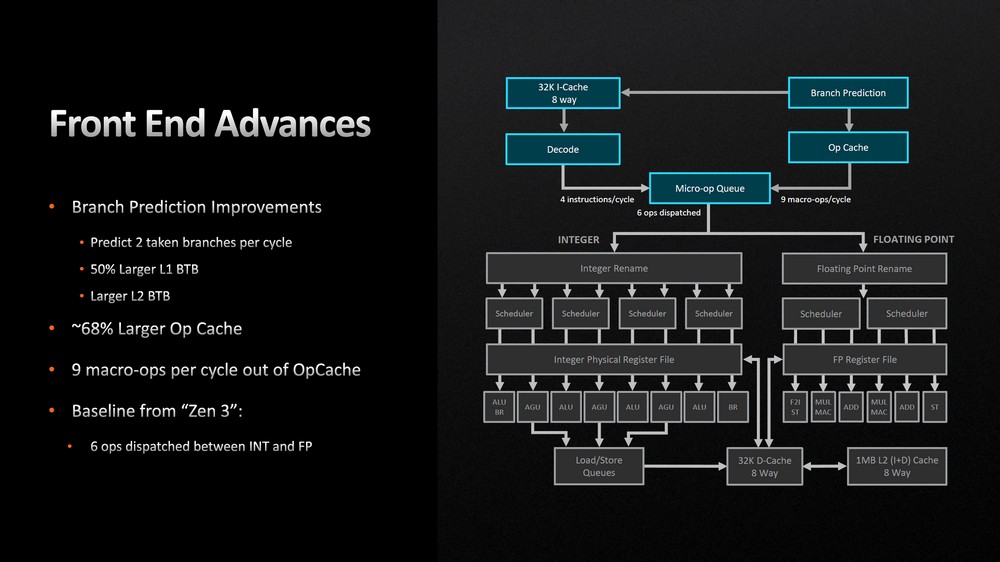
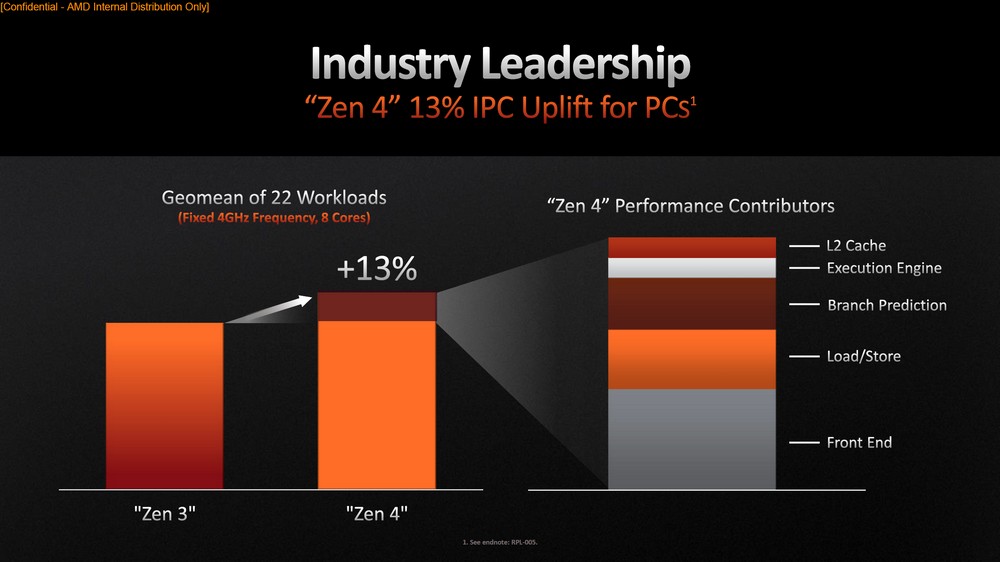
The AMD Zen 4 microarchitecture is an upgraded version based on Zen 3. The first is the enhancement of “front-end” branch prediction, 2 branches can be predicted per cycle, 50% larger L1 BTB, larger L2 BTB and 68% larger Op Cache; allowing Zen 4 architecture to output 9 macro-ops per cycle (Zen 3 is 6 macro-ops per cycle).
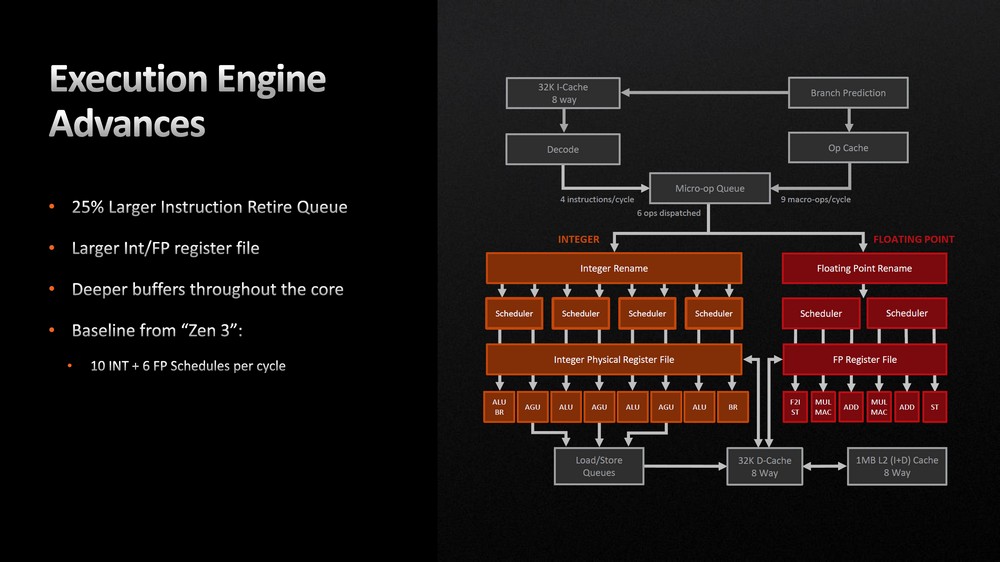
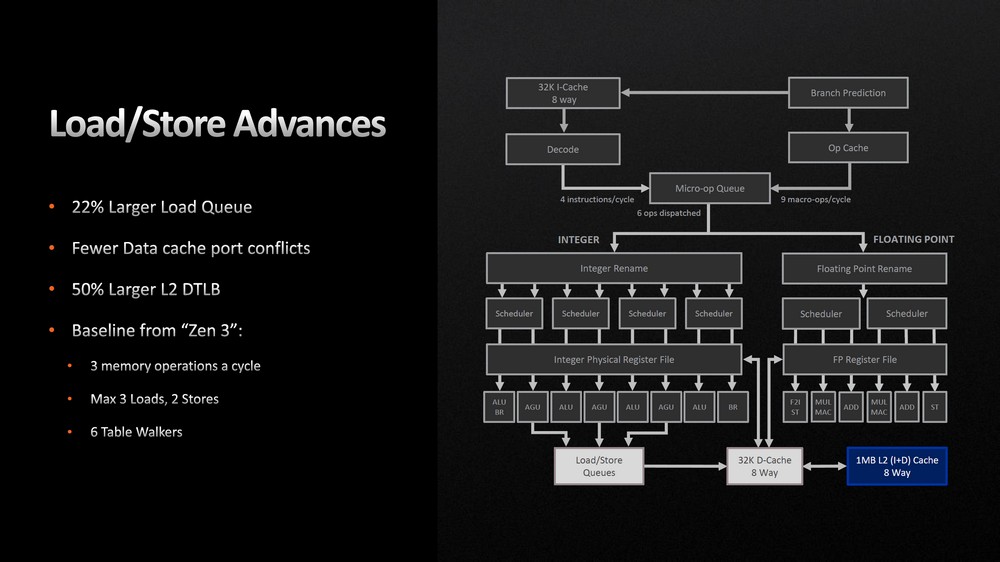
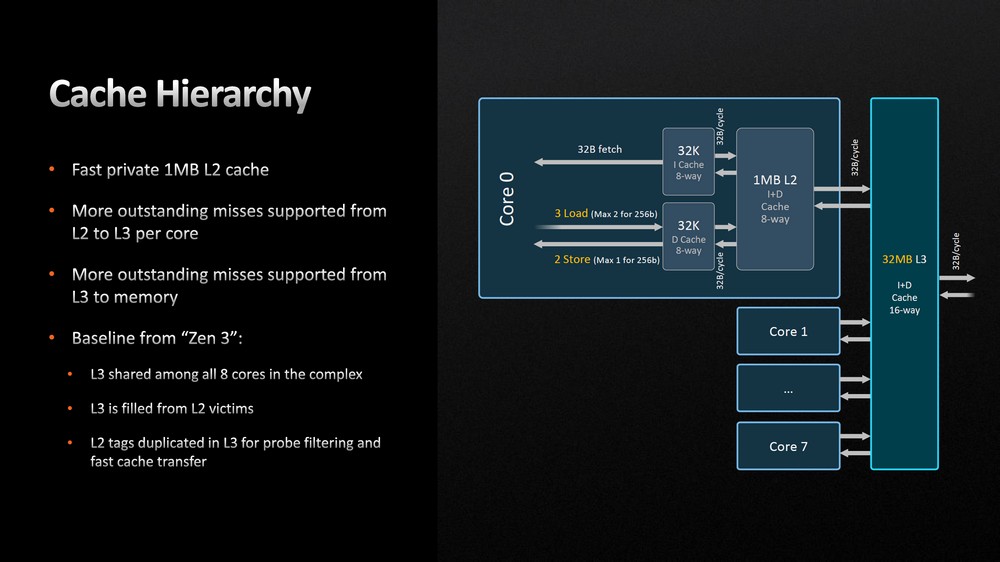
The core execution engine increases the Instruction Retire Queue by 25%, improves the Int/FP register file, and provides a deeper buffer so that the execution engine can maintain a fully loaded workload. And Load/Store also increases Load Queue by 22%, L2 DTLB by 50%, and reduces the data port conflict status of cache. In addition, each core doubled the L2 cache capacity from 512KB to 1024KB.
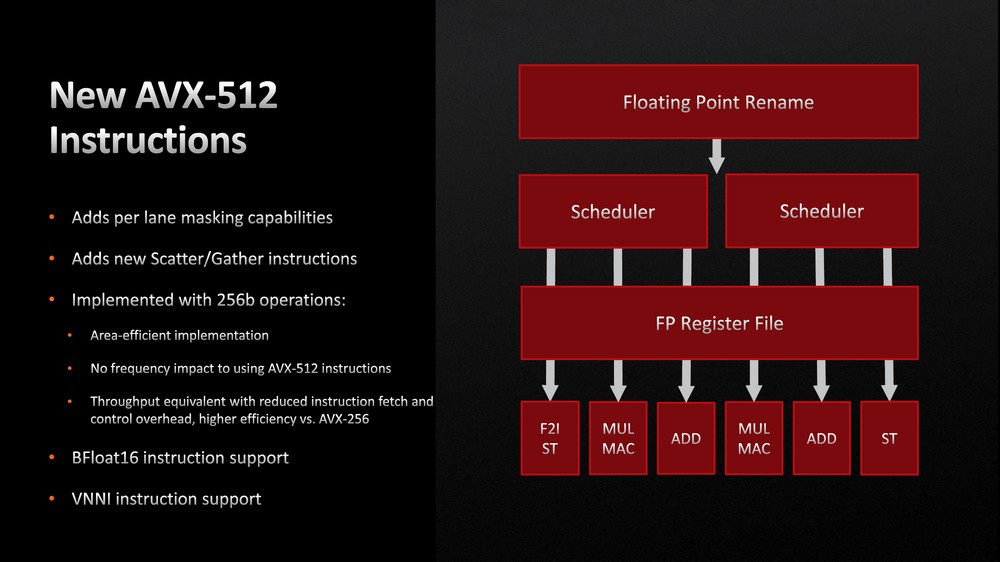
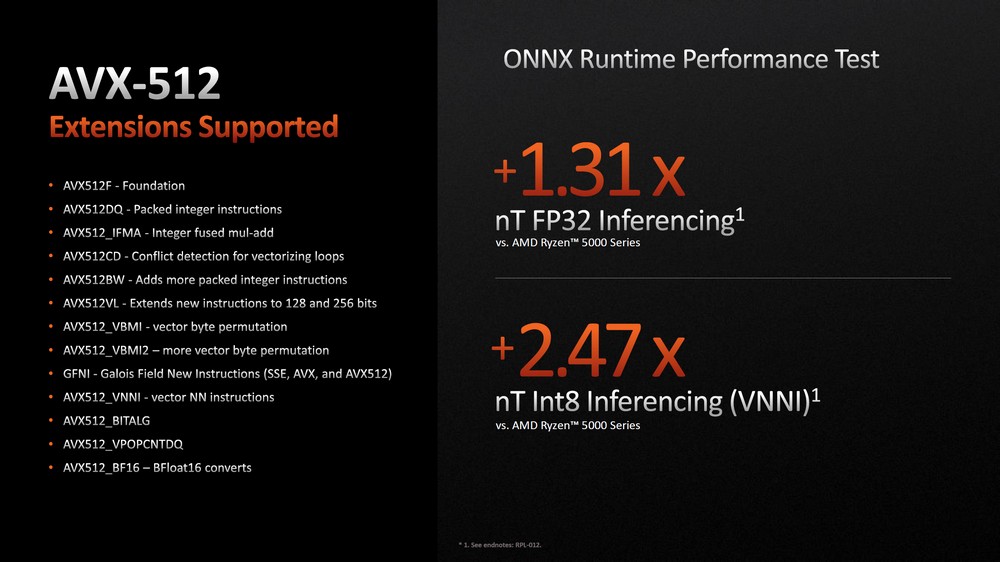
Zen 4 newly added the “AVX-512” instruction set, the purpose of which is to enhance the CPU’s AI inference ability, and AMD mentioned that the use of AVX-512 instructions will not affect the clock. Zen 4 delivers a 1.31x multi-core FP32 inference performance boost and a 2.47x multi-core Int8 inference (VNNI) performance boost.
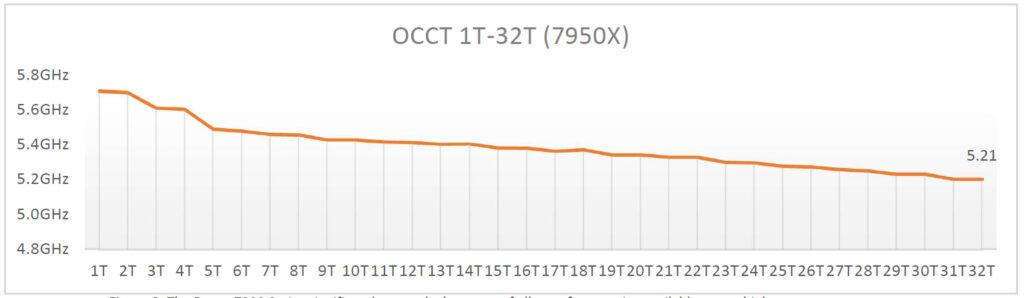
AMD mentioned: “The 13% increase in IPC can be attributed to the results of the upgrade of the processor front-end, Load/Store, branch prediction, execution engine and L2 cache.” Of course, TSMC’s 5nm process also contributed, so that This generation of Ryzen 7950X can reach 5.7GHz Boost at 1-2 threads and a high clock of 5.21GHz under full-core 32T load.
This allows the Ryzen 7000 series to achieve a 29% increase in single-core performance compared to the previous generation and a 49% increase in multi-core performance. Now AMD can also say loudly: “This generation also starts at 5.0GHz.”
6nm I/O Die integrates RDNA 2 internal graphics and AM5, X670, and B650 new platforms
Another interesting upgrade of this generation of Ryzen 7000 is the “motherboard”. The CPU uses a newly designed 6nm I/O Die to integrate an RDNA 2 internal display, DDR5 memory controller and more PCIe channels, with X670E, X670, The B650E and B650 motherboards allow gamers to get more M.2 NVMe SSD, USB and more expansion in this generation.
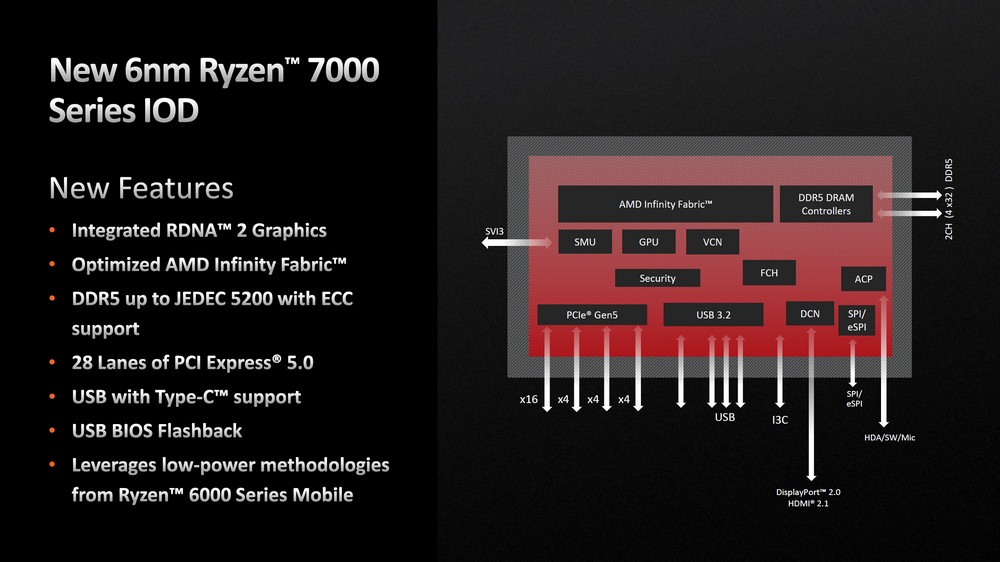
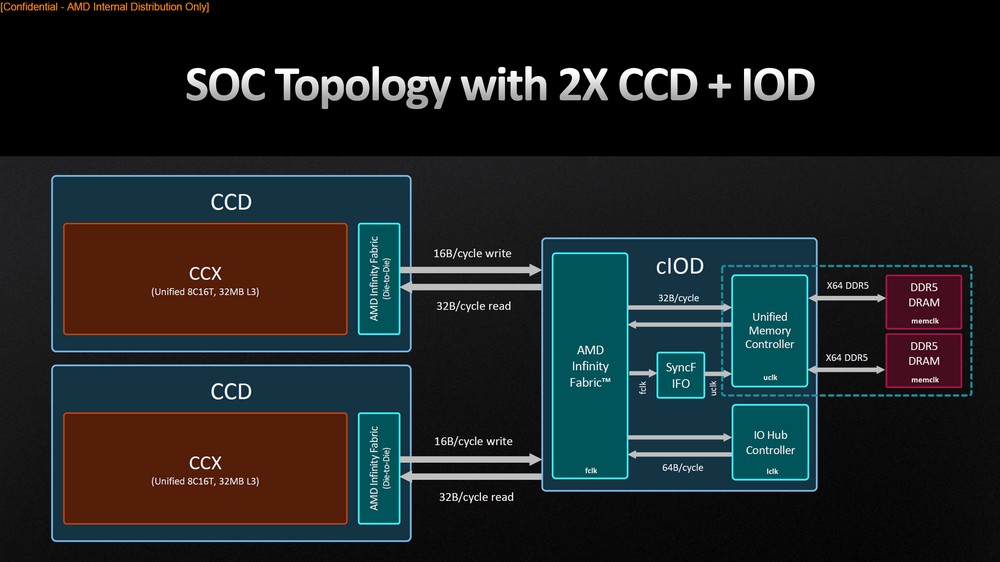
Ryzen 7000’s 6nm I/O Die integrates RDNA 2 graphics and optimizes AMD Infinity Fabric, built-in DDR5 controller supports JEDEC 5200 clock, and has 28 PCIe 5.0 lanes, providing x16 / x4 / x4 or x8 / x8 / x4 / x4 expansion function, and the SoC integrates functions such as USB Type C and USB BIOS Flashback.
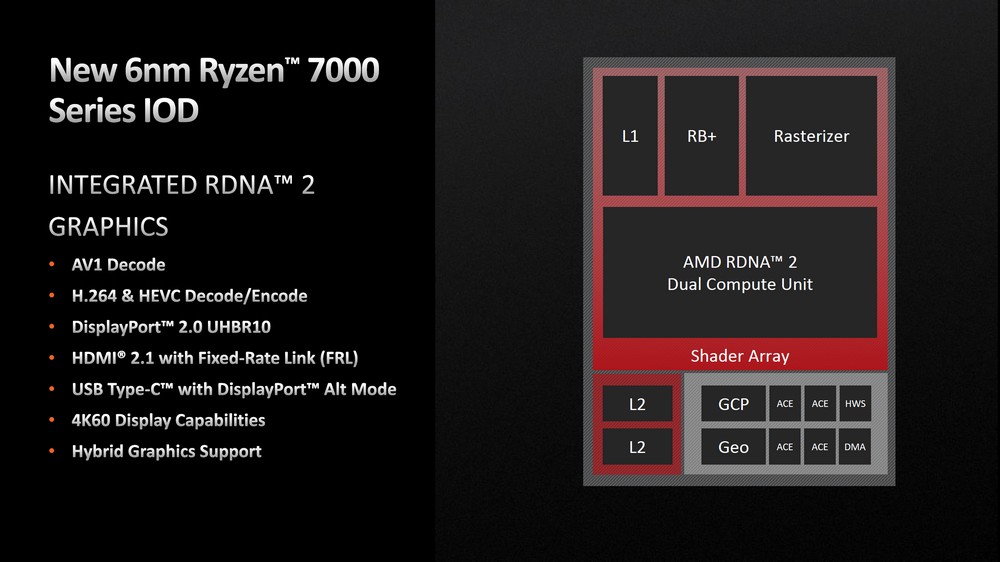
The processor’s built-in RDNA 2 architecture and the internal display core of 2 CU computing units can mainly provide 4K60 video and audio output capabilities, provide HDMI 2.1, USB-C DisplayPort Alt Mode output capabilities, and also have AV1 decoding, H.264 / HEVC codec function, even if it is just a document audio-visual machine, it can also be used for the bright machine function.
The Ryzen 7000 processor is upgraded to AM5 pin, using LGA package, 40 x 40mm package size, a total of 1718 pins, CPU SoC provides 28 PCIe 5.0 lanes, which can provide PCIe 5.0 x16 connection graphics card, 2 PCIe 5.0 x4 lanes Can be used as SSD or other expansion devices, in addition to 4 USB 10Gbps and 1 USB 2.0.
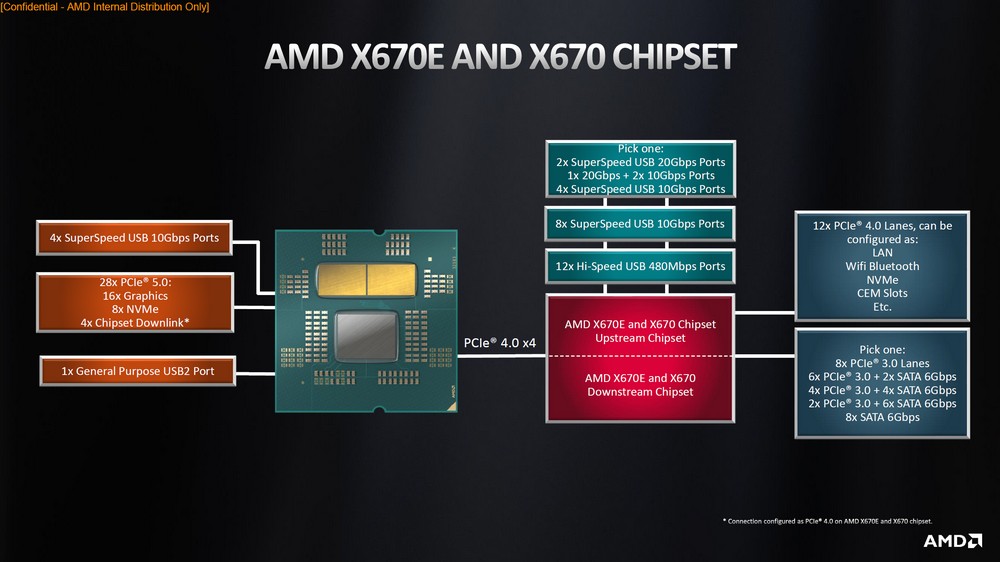
The suffix “E” at the back of this generation of X670 and B650 represents the word Extreme, which means that X670E and B650E motherboards will definitely provide PCIe 5.0 x16 graphics cards and PCIe 5.0 x4 SSD expansion functions; not E motherboards, then It is to provide PCIe 4.0 x16 graphics card but also have the expansion capability of a PCIe 5.0 x4 SSD.
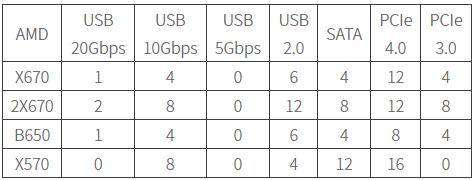
The X670 chipset can provide 12 PCIe 4.0 expansions, and through the serial connection of dual X670 chipsets, it can have a richer expansion design, such as 2 USB 20Gbps, 8 USB 10Gbps, and 12 PCIe 4.0, 4 PCIe 3.0 expansion capability.
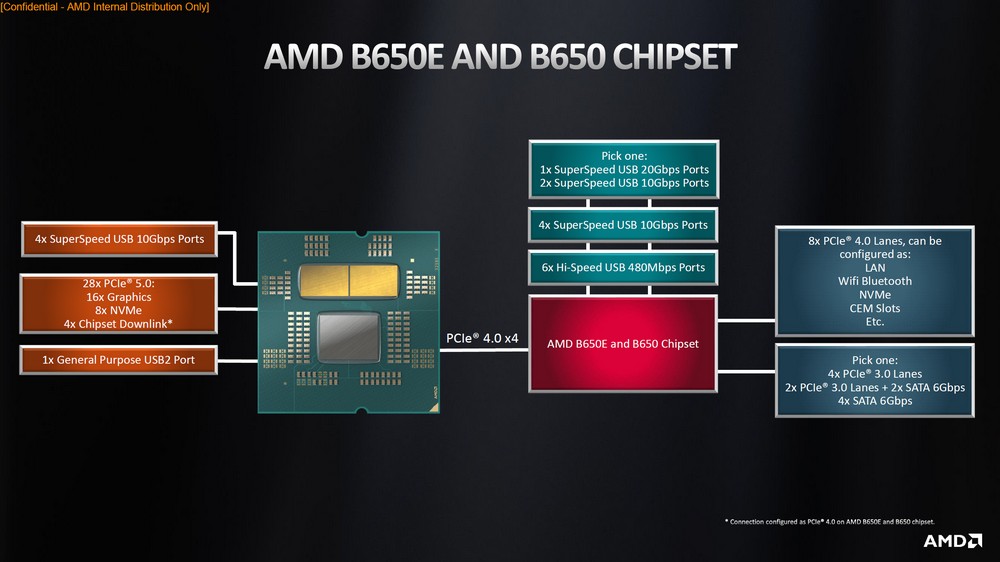
In contrast, the B650 can meet the basic installed specifications required by players, so it can also provide 1 USB 20Gbps, 4 USB 10Gbps, 6 USB 2.0, and 8 PCIe 4.0 and 4 PCIe 3.0 channels, This specification can definitely meet the installation needs of most players, just enough.
DDR5-6000 Sweet Spot and AMD EXPO Overclocking Memory Certification
For the overclocking of DDR5 memory of this generation of Ryzen 7000, it is recommended to set it to “AUTO:1:1”, that is to keep AMD Fabric Frequency (fclk) automatic, and keep Memory Controller (uclk) and DRAM Frequency (memclk) at 1 :1 ratio instead of the 1:1:1 of the previous generation Ryzen 5000.
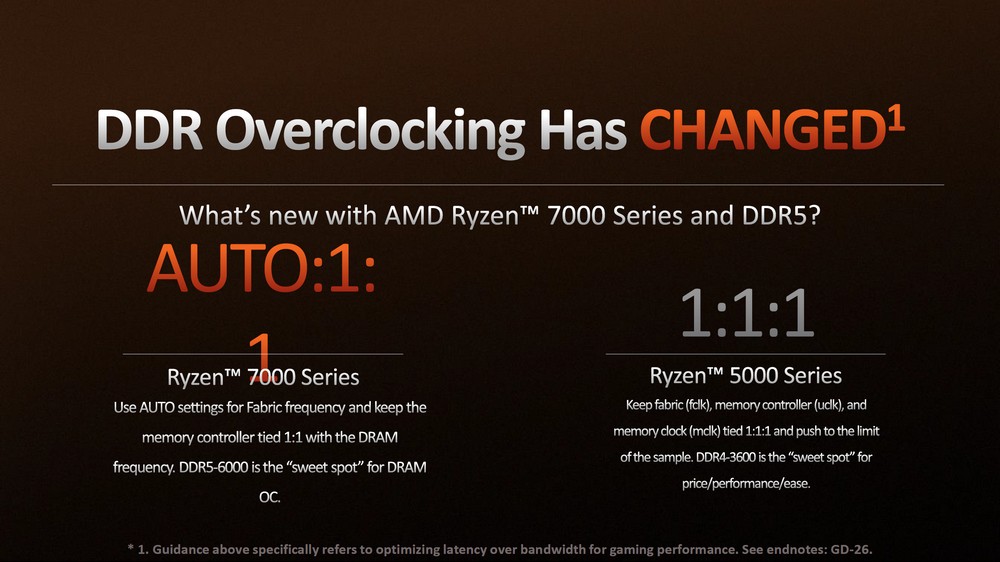
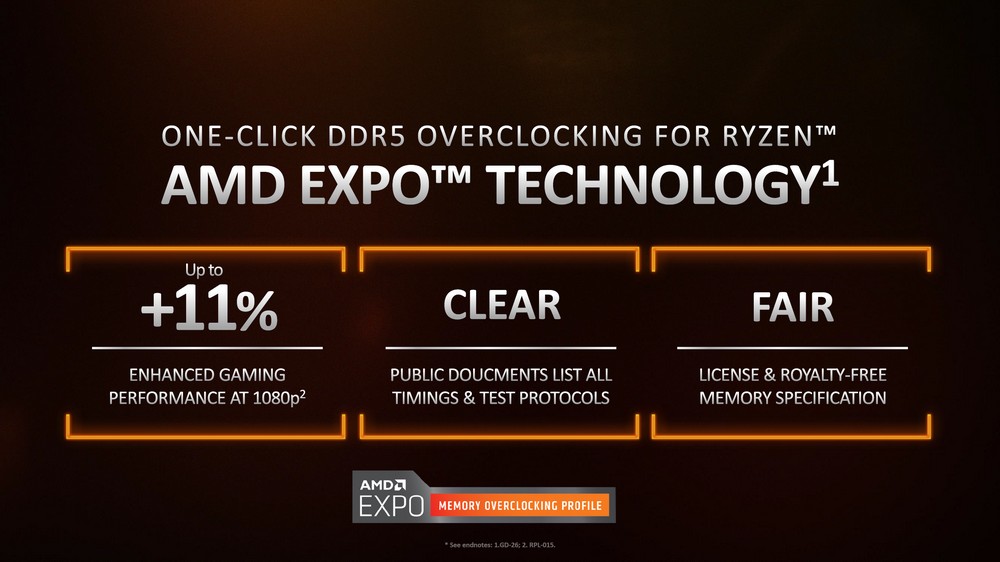
And AMD also mentioned that this generation of “DDR5-6000” overclocked memory is the sweet spot for performance and latency. At the same time, AMD also provides “EXPO” overclocking memory certification, which provides clean and public documents including all timing parameters and test protocols, and is an overclocking memory certification without authorization.
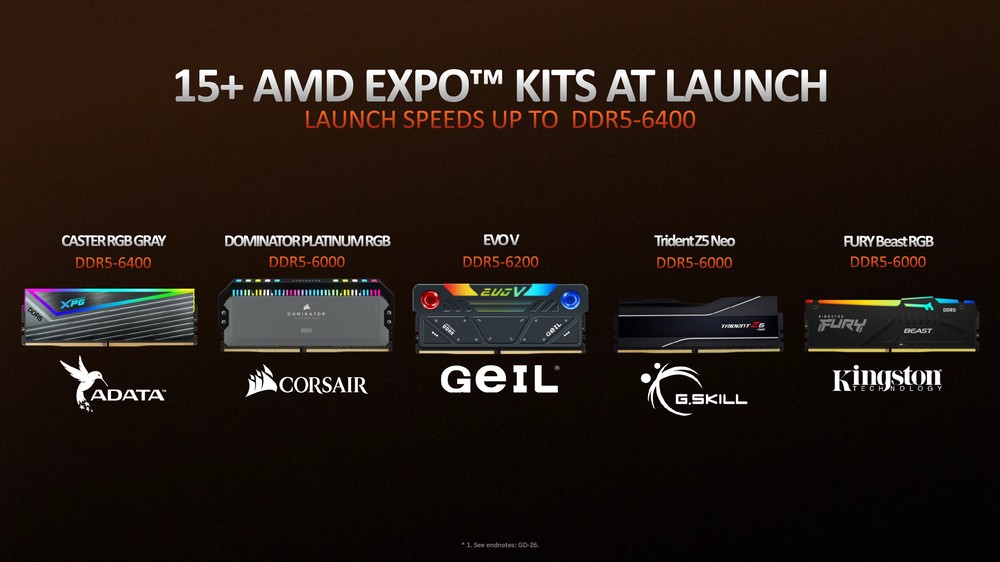
Various DRAM module manufacturers will also start selling AMD-specific EXPO memory, or dual-certified memory that supports XMP and EXPO; as for motherboard manufacturers, they will also provide new versions of BIOS to support AMD or Intel’s DDR5 platforms. Overclocking memory for EXPO and XMP.
Test platform and setup
This generation of AMD’s clock boost and power consumption is undoubtedly a head-to-head confrontation with Intel. The first wave of lifting the ban will focus on the Ryzen 9 7950X and Ryzen 5 7600X tests, and will compare Intel Core i9-12900K and i5-12600K, as well as the previous generation. Ryzen 5950X and 5600X to see how this generation’s progress compares to its rivals. (The remaining 7900X and 7700X will be added after the ban is lifted.)
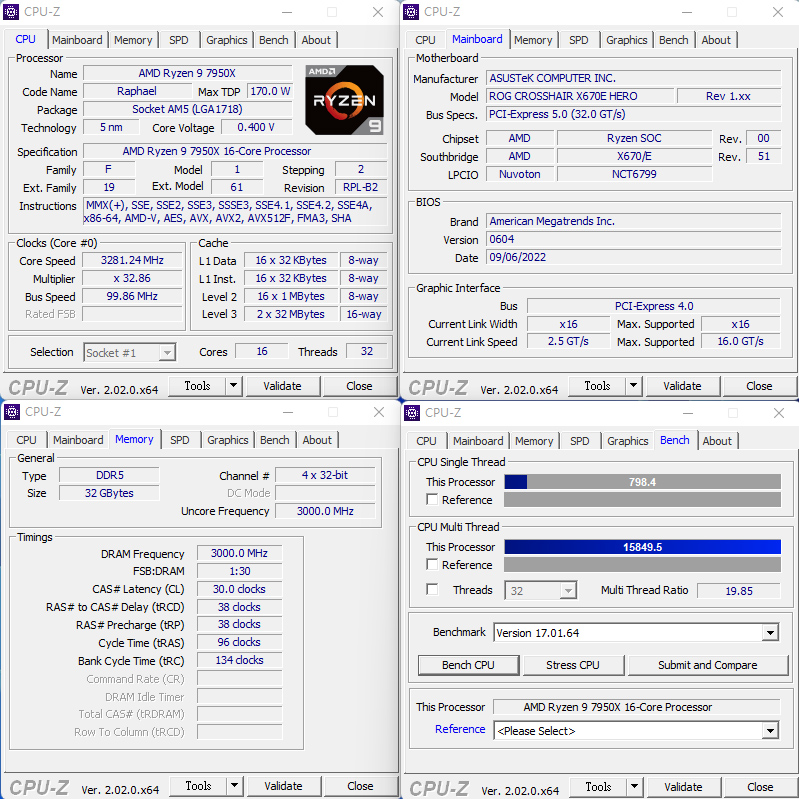
In the test, use the motherboard default Auto and apply the DDR5-6000 EXPO memory settings; the test platform is provided below for your reference.
Test Platform
Processor: AMD Ryzen 9 7950X, 7600X
Motherboard: ASUS ROG CROSSHAIR X670E HERO 0604
Memory: G.SKILL TRIDENT Z5 NEO DDR5-6000 16GBx2
Graphics Card: NVIDIA GeForce RTX 3080 Ti
System Disk: Solidigm P41 Plus 1TB PCIe 4.0 SSD
Cooler: ASUS ROG STRIX LC II 280mm
Power Supply: Seasonic PRIME PX-1000
Operating System: Windows 11 Pro 21H2
Processor: AMD Ryzen 5950X, 5600X
Motherboard: ASUS ROG Crosshair VIII Dark Hero 4201
Memory: G.SKILL DDR4 8GBx2 3600MHz
Processor: Intel Core i9-12900K, i5-12600K
Motherboard: ASUS ROG MAXIMUS Z690 HERO 2004 / ASRock Z690 Tiachi 11.01
Memory: G.SKILL TRIDENT Z5 NEO DDR5-6000 16GBx2

Processor computing performance Cinebench, VRay rendering test
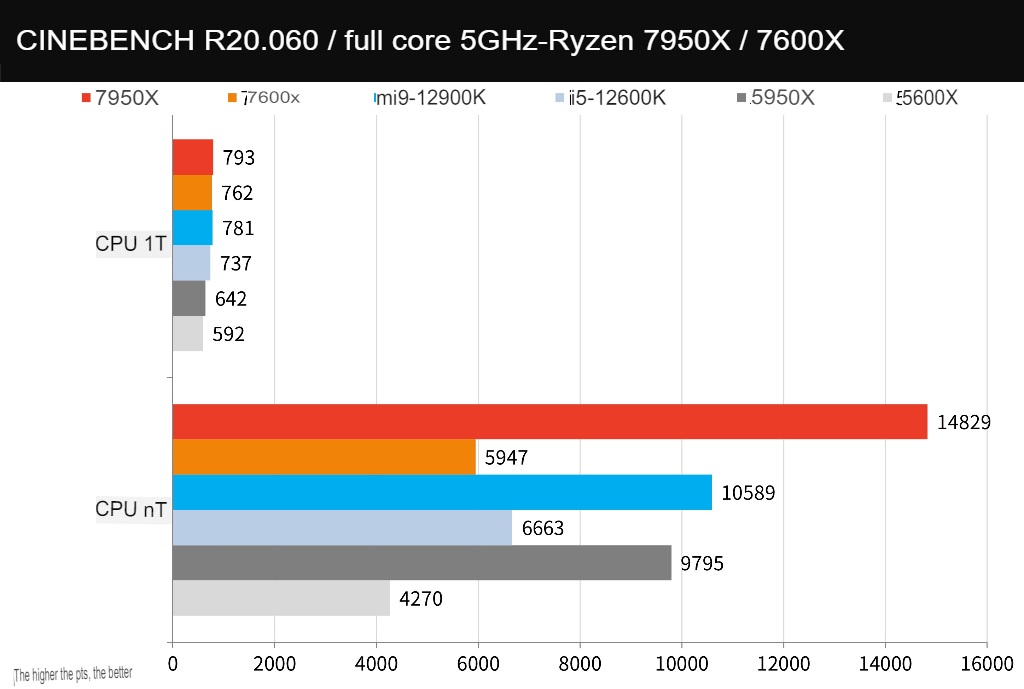
CINEBENCH R20 , developed by MAXON based on Cinema 4D, can be used to evaluate the 3D rendering performance of computer processors. It is also a reliable test software that can quickly evaluate CPU multi-core computing performance.
The 7950X beat the i9-12900K’s 10,589 points with a high score of 14,829 points for nT multi-threading, and the performance improved by 40%; in terms of single-thread 1T, the 7950X scored 793 points, and the i9-12900K scored 781 points. 1.5% ahead.
As for the 7600X, it is nT 5947 and 1T 762 points. In contrast, nT loses to i5-12600K by about -10.7%, but in 1T performance, it has a better performance lead of 3.4%.
Compared with the previous generation 5950X, the 7950X has a performance improvement of 51% in nT and 23.5% in 1T; as for the 7600X compared with 5600X, it is 39.3% in nT and 28.7% in 1T.
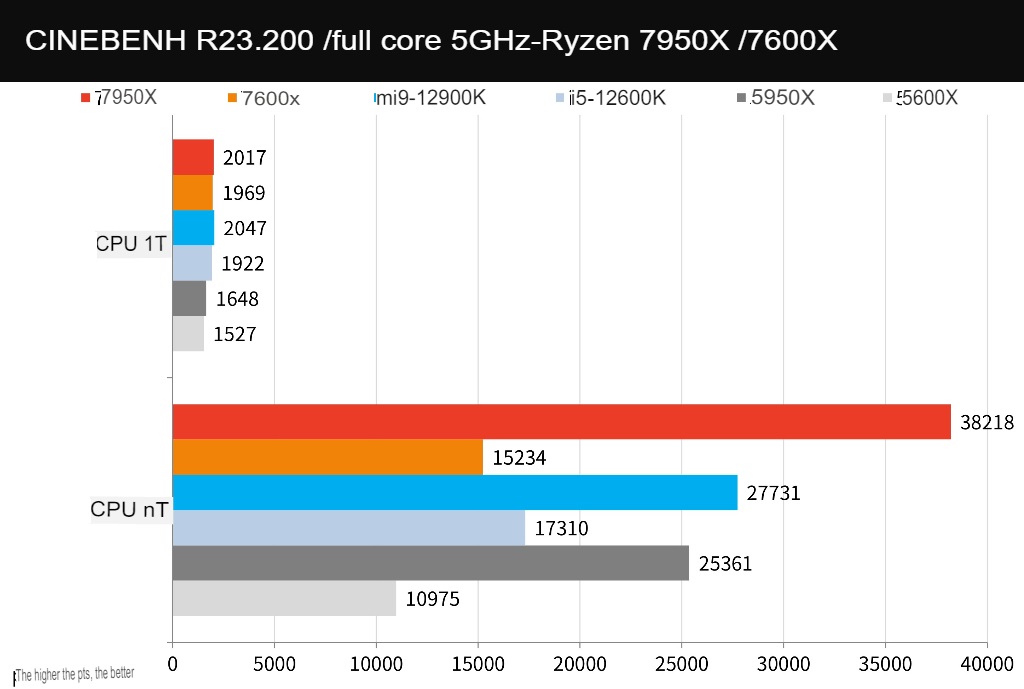
CINEBENCH R23 has the same test situation as R20. It uses a new compiler and has a stress test function. Players can customize the Minimum Test Duration time, such as 10 or 30 minutes to test the stability of the computer; however, the results of R23 cannot be compared with R20.
The 7950X multi-threaded nT achieved 38218 points and single-threaded 2017 points, compared to the i9-12900K’s nT 27731 points, leading 37.8%, 1T 2047 points, slightly slower -1.5% performance.
As for the 7600X, it is nT 15234 and 1T 1969 points. In contrast, nT loses to i5-12600K by about -12%, but in 1T performance, it has a better performance lead of 2.4%.
The generation comparison is that the 7950X has a 50.7% performance improvement in nT compared to 5950X and 22.4% in 1T; as for 7600X compared with 5600X, it is 38.8% in nT and 28.9% in 1T.
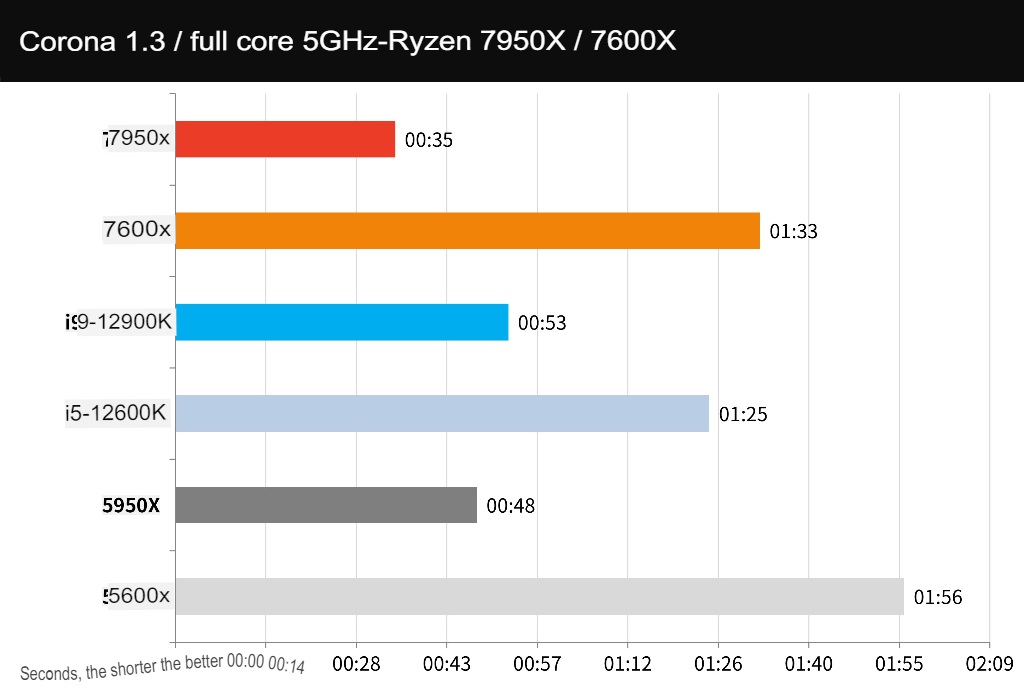
Corona Benchmark is a relatively easy-to-operate test tool, using Corona Renderer 1.3 renderer for testing, comparing the rendering speed of the processor and the performance of Rays/s, and the score is the timing in seconds.
The 7950X completed the task in just 35 seconds, which is significantly faster than the 53 seconds of the i9-12900K. The 7600X is 1 minute 33 seconds slower than the i5-12600K.
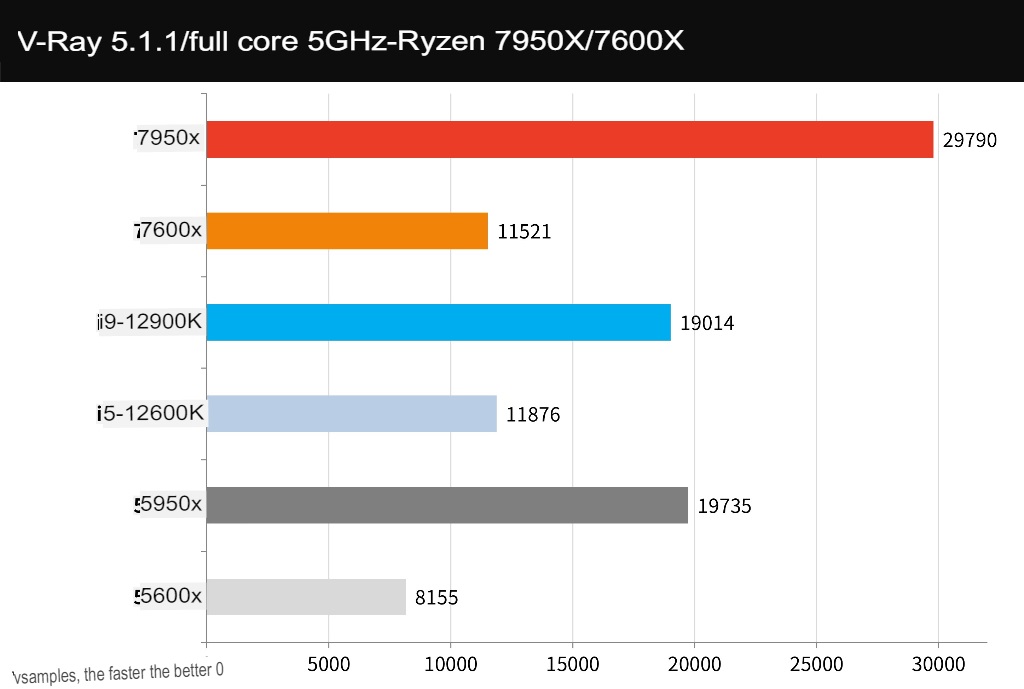
V-Ray Benchmark is developed by Chaos Group. V-Ray is a ray rendering software designed based on the laws of physics. This tool can be used for CPU performance testing of ray tracing rendered images. The CPU score is calculated in samples per second. number as a unit.
The 7950X scored 29,790 points, ahead of the i9-12900K’s 19,014 points, with a performance lead of about 56.7%. The 7600X scored 11,521 points, but lost as little as -3% to the i5-12600K.
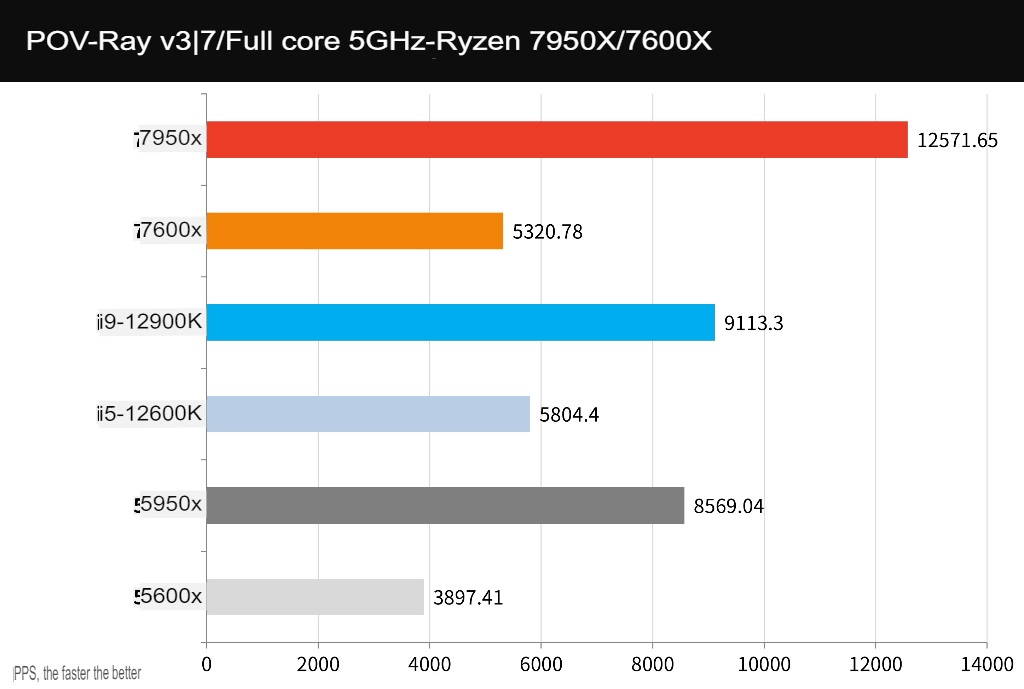
POV-Ray is another set of free ray tracing 3D rendering tools. It uses the computing power of a multi-core CPU to calculate the rendering of light and shadow and 3D images.
The 7950X won the championship with 12571 PPS, which is 37.9% faster than the i9-12900K’s 9113 PPS. The 7600X has a performance of 5320 PPS, which is also slightly lower than the performance of the i5-12600K by about -8.3%.
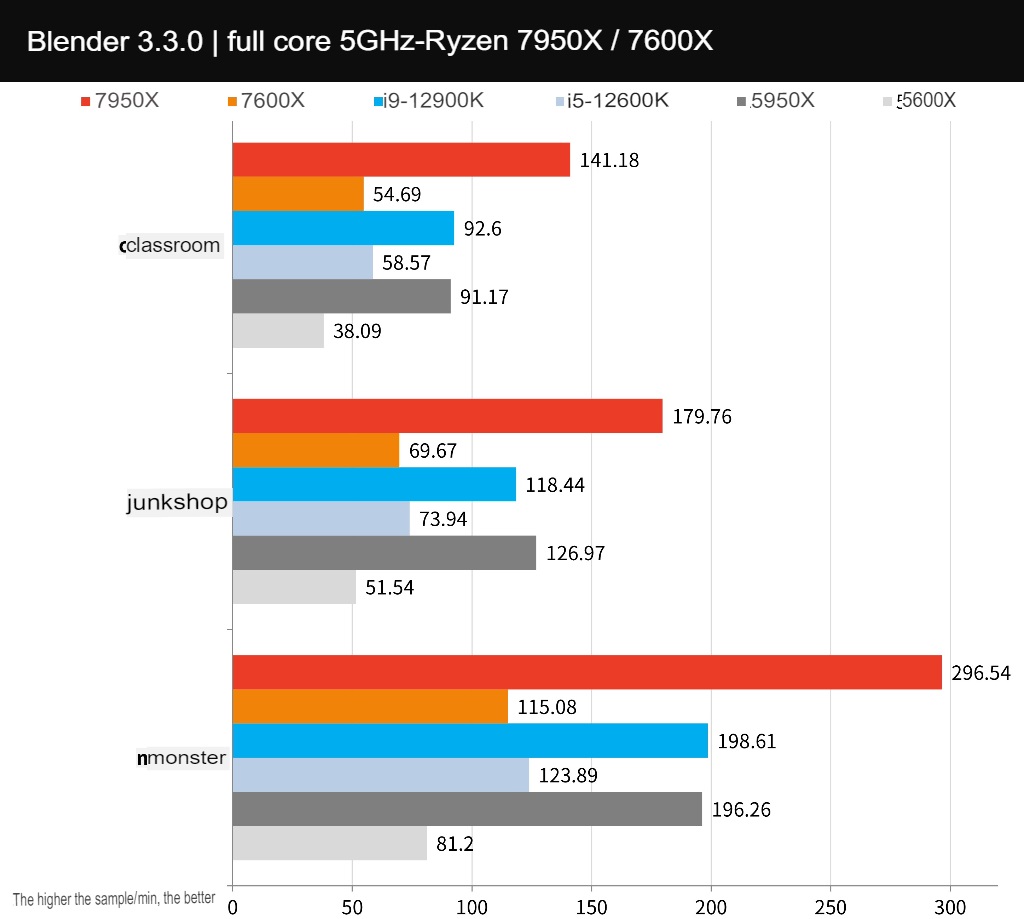
Blender is a cross-platform, open source 3D authoring tool that supports CPU and GPU rendering acceleration, as well as various 3D operations: Modeling, Rigging, Animation, Simulation, Rendering, Compositing, and Motion Tracking.
Through the Blender Benchmark 3.3.0 test, the 7950X has achieved quite strong results in monster, junkshop, classroom and other scenes, and the results of this test are also the same as the above-mentioned rendering test results, which are provided for your reference.
Summary: From the perspective of CPU multi-core rendering performance, Ryzen 7950X has quite powerful multi-core performance to beat i9-12900K, and even has a chance to compete with i9-13900K in the future. However, the 7600X, which has fewer cores than its opponents, cannot directly win the comparison i5-12600K in terms of multi-core.
Creative PR image output, LR and PS photo editing performance test
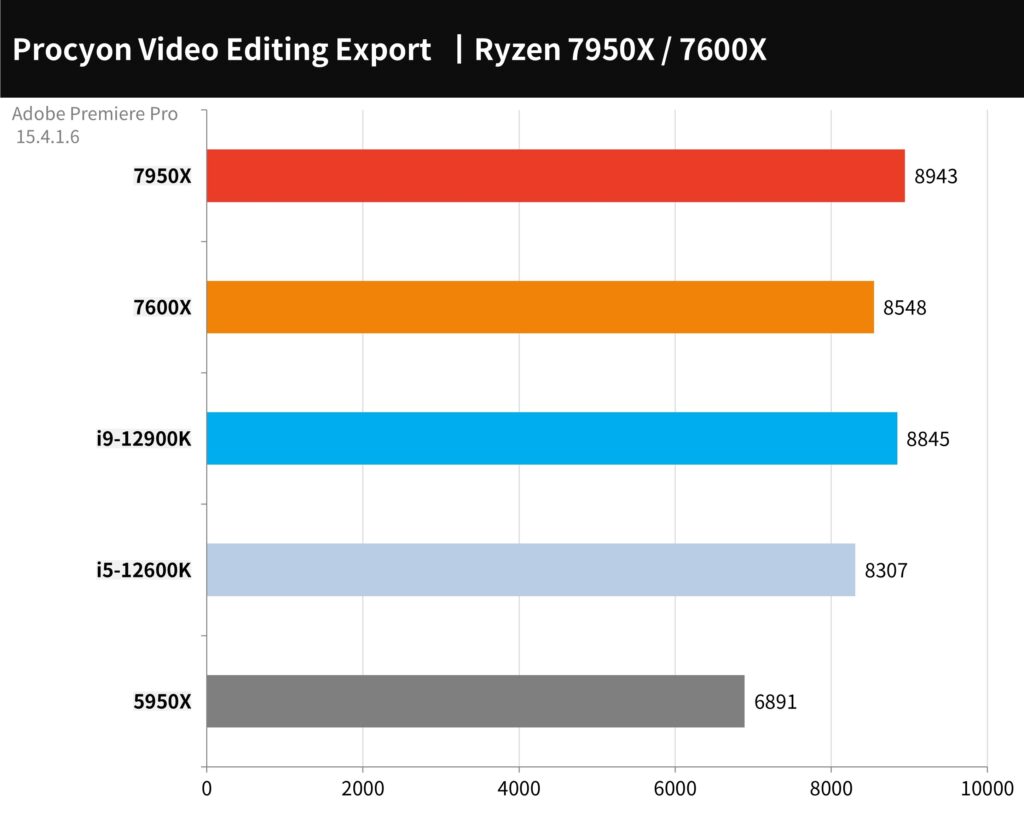
For the conversion output test of Adobe Premiere Pro 2020, this time using the UL Procyon Video Editing Benchmark test tool, the test scenario is a video using 2160p 30/60 FPS, and the output is H.264 – YouTube 1080p Full HD and HEVC (H.265 ) – 4K UHD format, and compare the output performance of pure CPU output and added GPU acceleration. The test uses an RTX 3080 Ti graphics card.
In terms of performance, the 7950X won the championship with 8943 points, surpassing the i9-12900K’s 8845 points, and the 7600X also scored 8548 points. However, the performance gap is relatively small, which also shows that the main force of video and audio output work is to rely on GPU acceleration to shorten the output time. However, if the special effects of the image are not necessary for CPU operation, a high-core processor is still required for operation.
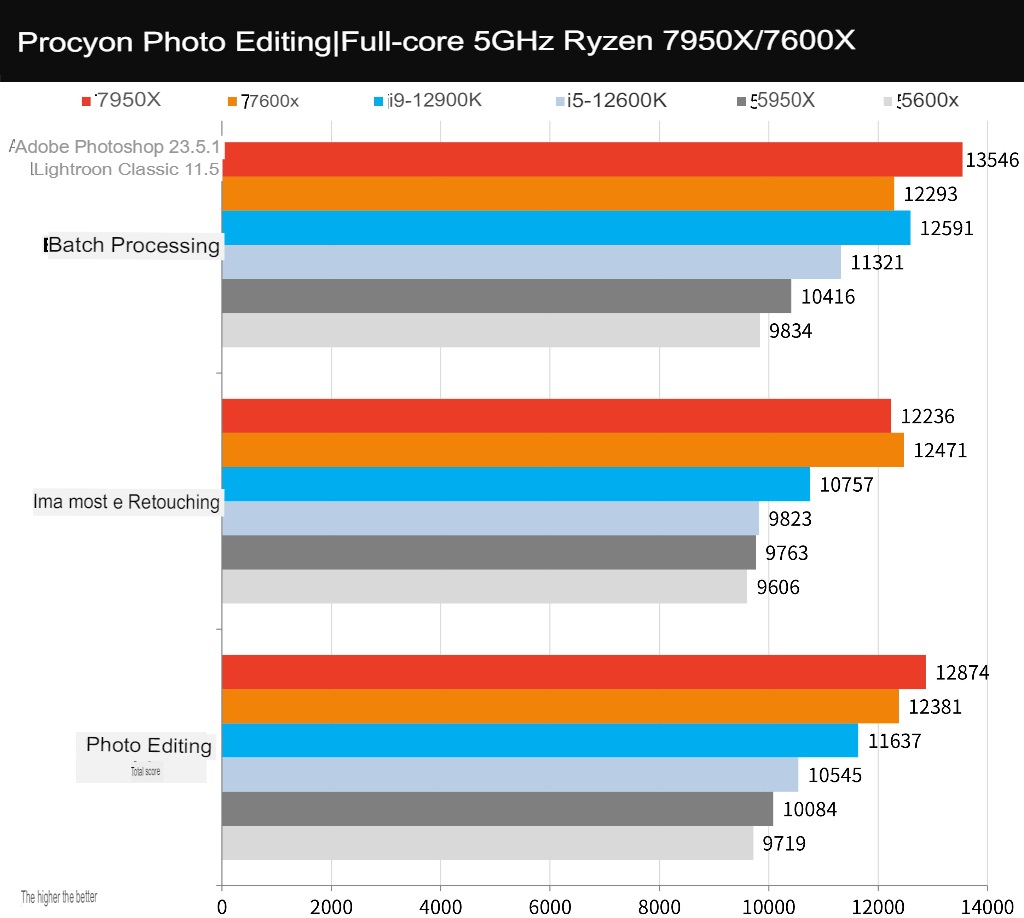
Adobe Photoshop and Lightroom Classic use the UL Procyon Photo Editing Benchmark test tool; the two working scenarios tested, Image Retouching test is to use Photoshop for photo editing and record the time of each step, while Batch Processing test is batch processing Use Lightroom to adjust and export a large number of photos.
In terms of total points, the 7950X won the championship with 12874 points, and the 7600X had 12381 points, winning the i9-12900K with 11637 points. The test of photo editing and batch output is relatively dependent on the CPU core and clock, and this performance can also feel the performance improvement of the Ryzen 7000.
AIDA64 processor memory, 7-Zip compression test
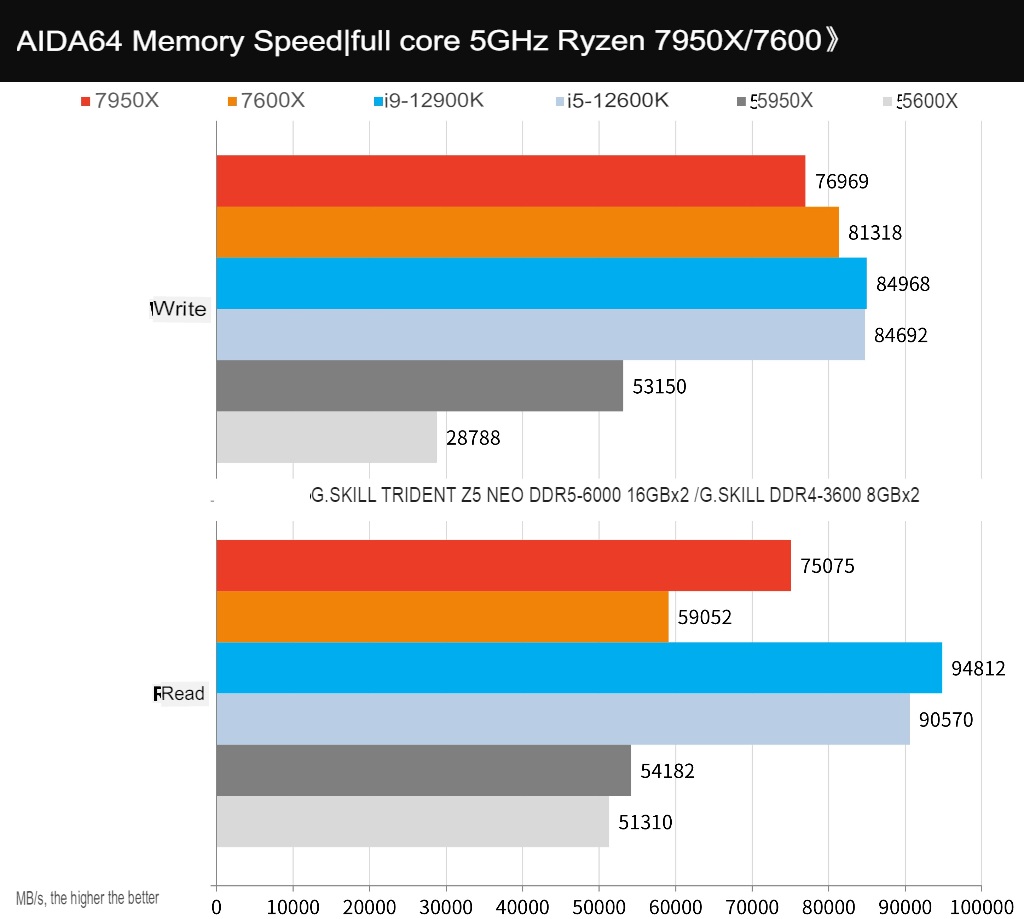
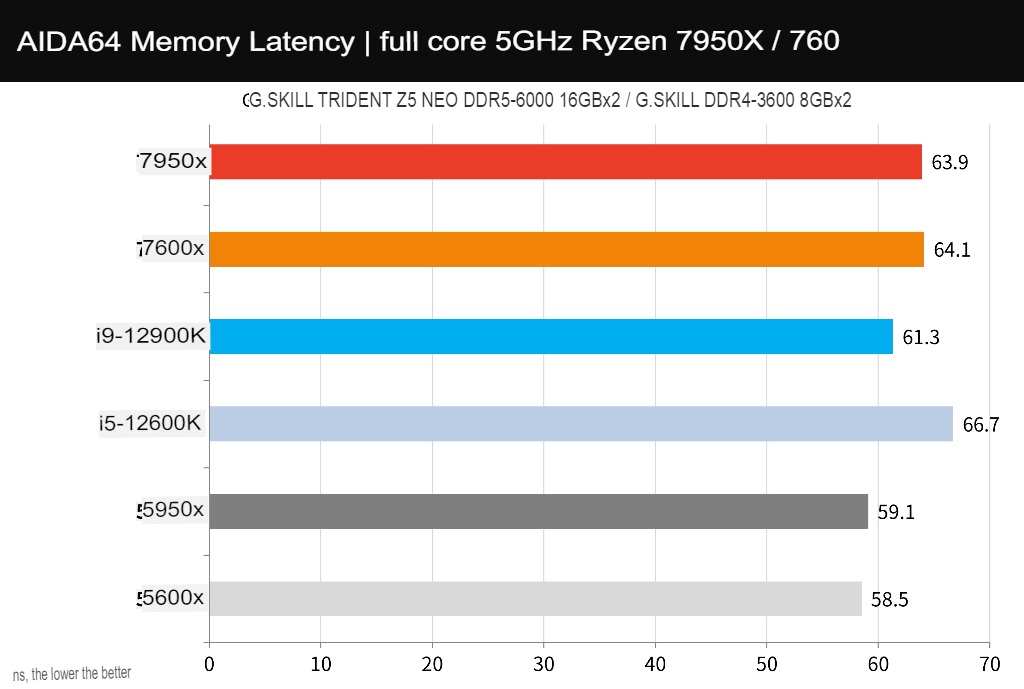
The memory test is carried out using AIDA64, but AIDA64 has not been officially optimized for the Ryzen 7000 processor, so there should be room for improvement in the test memory read and write performance.
The current test results seem to be a bit strange. In short, the current memory performance will be more accurate after AIDA64 is updated, so this data is provided for your reference.
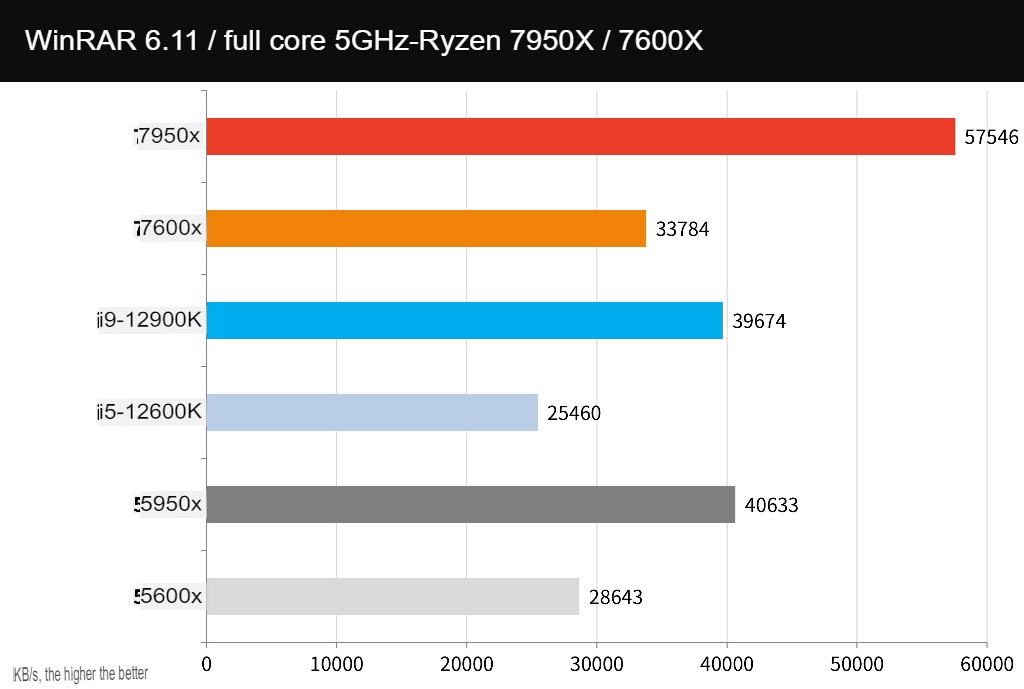
WinRAR is the most commonly used compression tool. In terms of performance, the 7950X can achieve a performance of 57546 KB/s, which is better than the 39674 KB/s of the i9-12900K and 33784 KB/s of the 7600X.
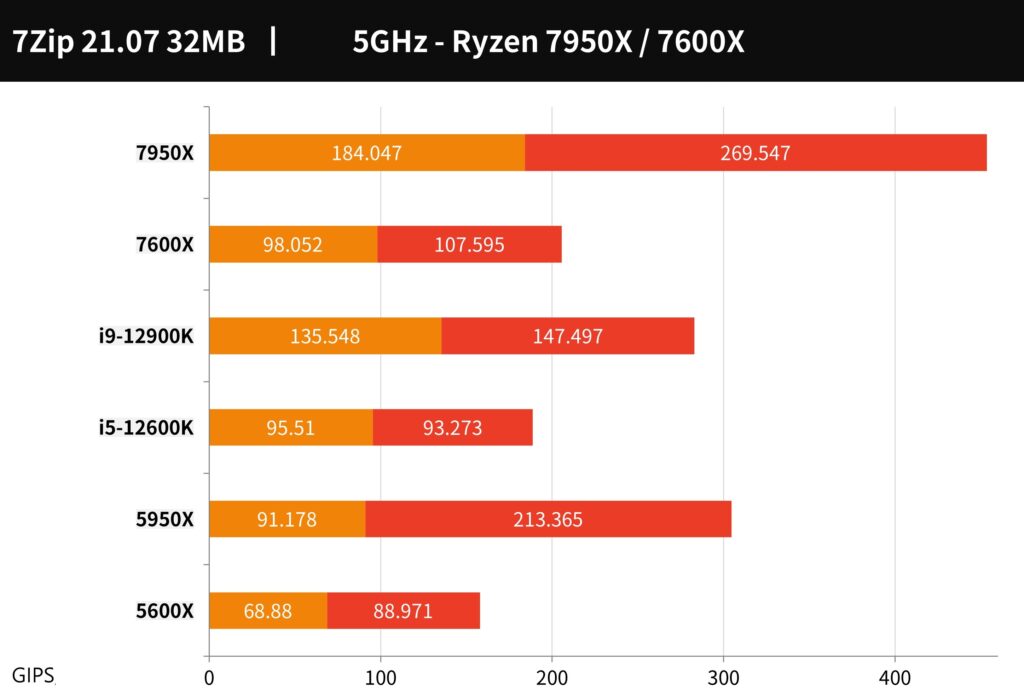
7-Zip is another well-known and free compression tool that can effectively utilize the performance of multi-core. In terms of GIPS performance of compression and decompression, the 7950X still wins the championship and far outperforms the i9-12900K.
PCMark 10, CrossMark and Office PC benchmarks
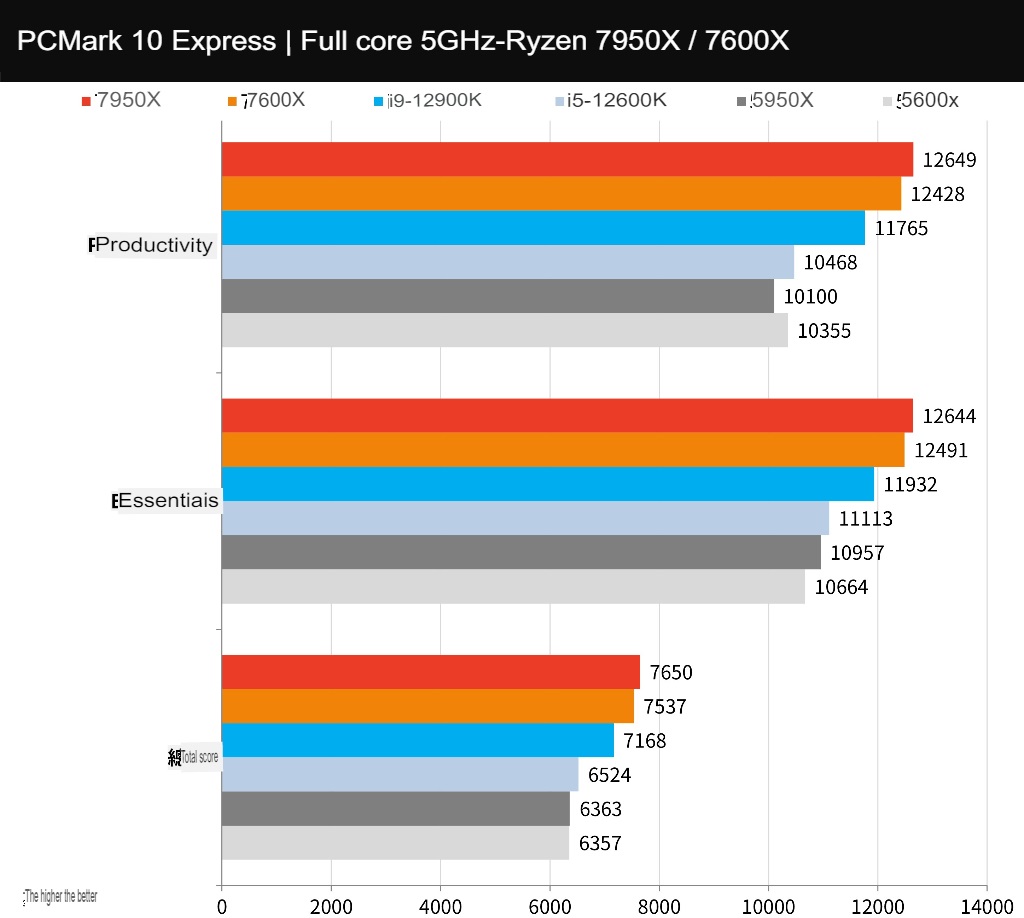
The overall performance of the computer is first tested with PCMark 10 Express, which can be used to score basic computer tasks in Essentials, such as app startup speed, video conferencing, and web browsing performance. The Productivity test uses spreadsheets and paperwork as test items.
The 7950X achieves a high score of 7650 points, the 7600X has 7537 points, and even beat the i9-12900K’s 7168 points. For computer performance, the 7950X is 20% more efficient than the previous generation 5950X, and the 7600X is 18.6% more efficient than the 5600X.
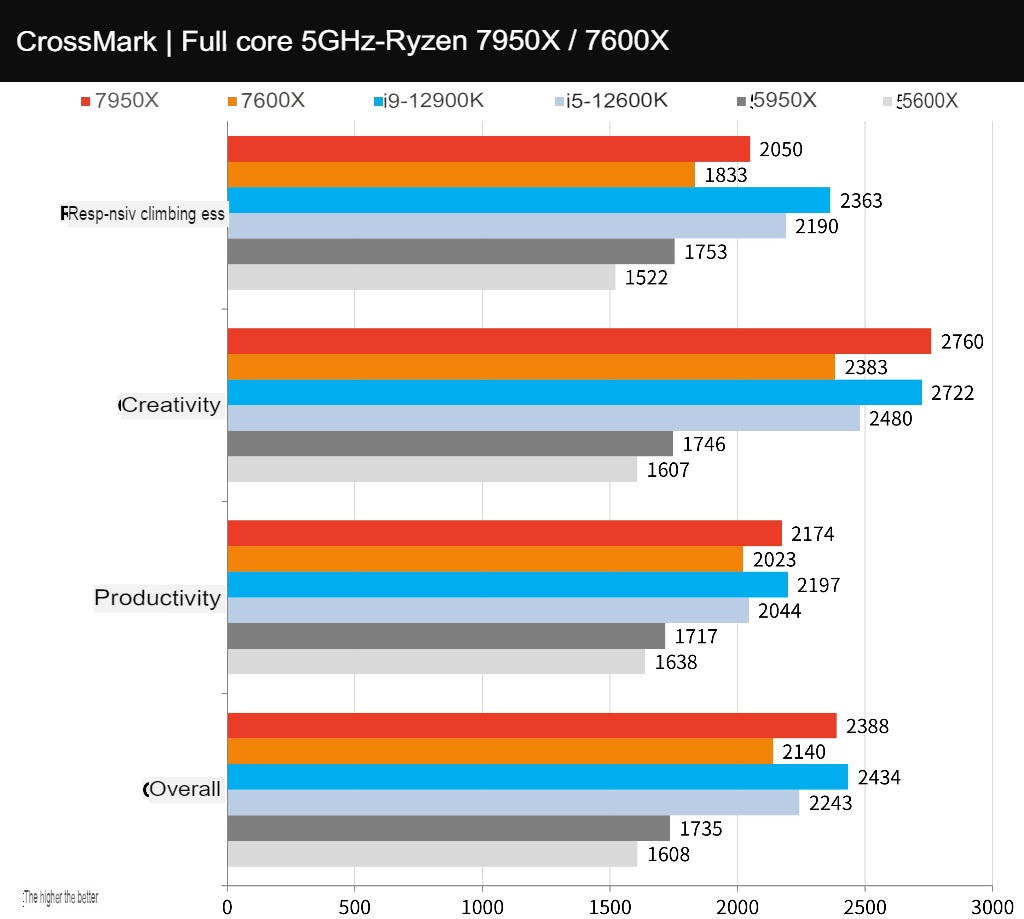
CrossMark, a cross-platform computer performance testing tool, is a free testing tool developed by BAPCo. It supports platforms such as Windows, iOS/iPadOS, macOS, and Android, and is aimed at computer productivity, such as text editing, spreadsheets, web browsing, Creative photo editing, organizing and video editing work, plus computer response speed for testing.
The 7950X scored 2388 points, and the 7600X scored 2410 points. Although it is impossible to beat Intel in this project, this generation has significant performance upgrades in productivity, creation and faster response speed. It can be seen that this generation has improved clockwork and architecture. the advantages brought about.
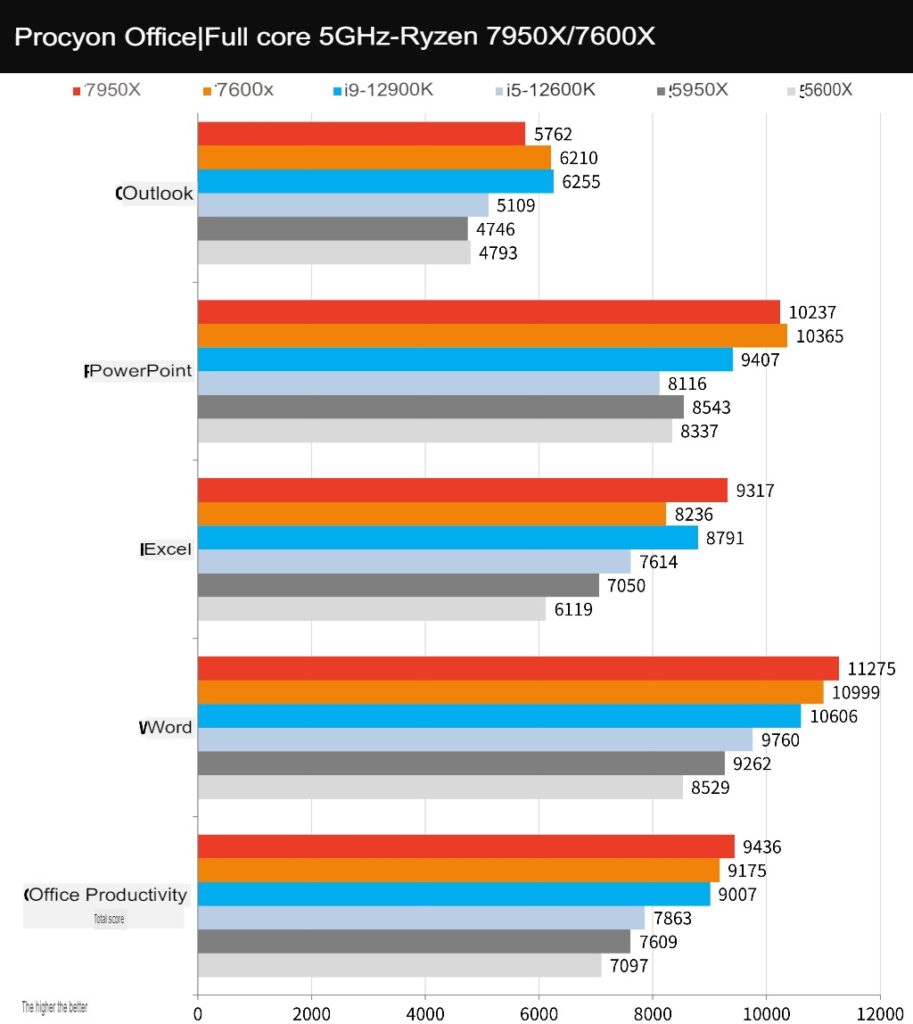
UL Procyon Office Productivity Benchmark uses Microsoft Word, Excel, PowerPoint and Outlook to test the practical and real performance of Windows computers in daily work, and design test scenarios with common paperwork, from document opening, copying, input, trial calculation Calculation, sorting, exporting of tables, adding files, pictures, videos and emails to and from presentations, etc.
In the test, the 7950X won the championship with 9436 points, followed by the 7600X with 9175 points, winning the i9-12900K’s 9007 points.
Compared with the previous generation 5950X, the 7950X has a 24% performance improvement, and the 7600X has a 29.3% improvement compared to the 5600X.
3DMark CPU performance and FS, TS benchmarks
Computer graphics game performance test tool 3DMark, the mainstream Direct X11 test Fire Strike and Direct X12 Time Spy test.
Judging from the running scores, the 7950X scored 47,806 physical scores in Fire Strike, and the 7600X scored 30,360 points. As for the Time Spy test, the 7950X scored 19602 points in the CPU, and the 7600X scored 10484 points.
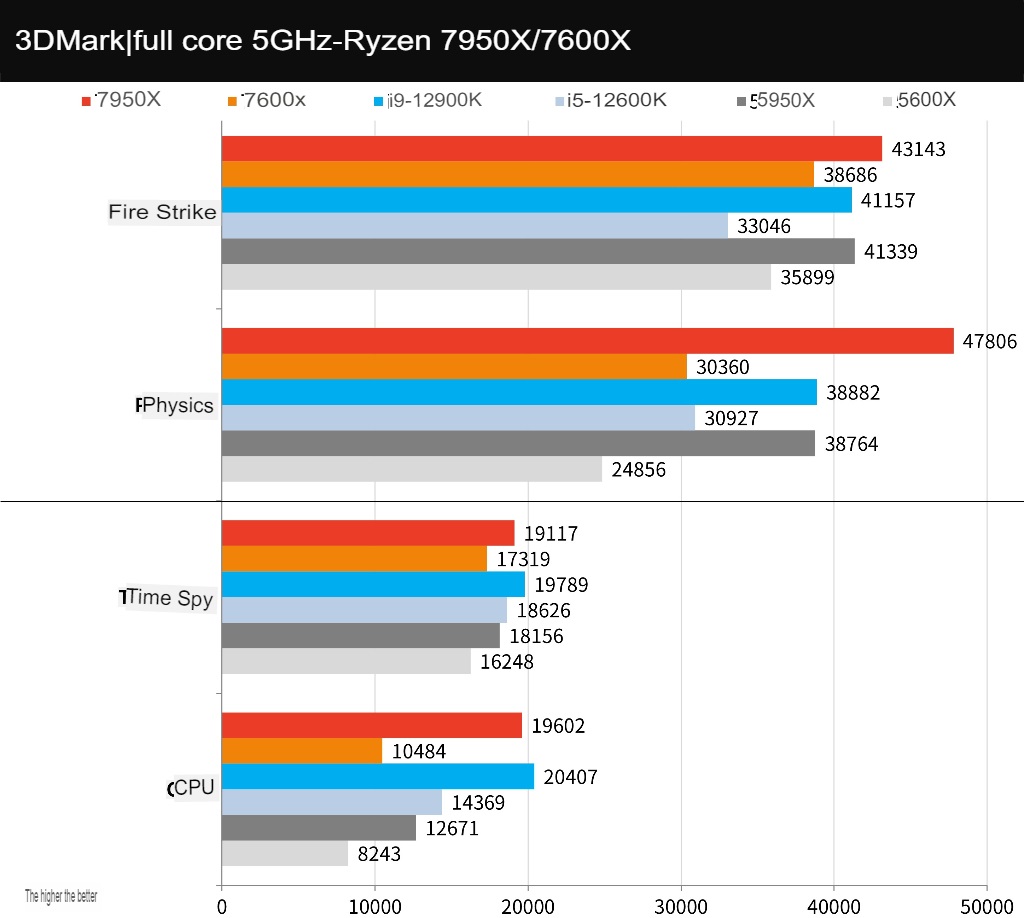
The 3DMark CPU test mainly tests the physical operation and custom simulation of the CPU and tests the performance of 1, 2, 4, 8, 16 and the maximum thread of the processor respectively, and the performance of more than 16 threads will belong to 3D Rendering, audio and video output will be used. Generally, Direct X12 games prefer 8T threads, and the following threads are the preferences of old games.
In the 1T-4T-test, the processor performance is quite close, but at 8T, although the 7950X has a score of 7700, it is slightly lost to the i9-12900K’s 7916 points, but when it is upgraded to 16T and MAX, the 7950X wins without any suspense. . It can be seen that Intel still has higher performance under the Direct X12 game preference 8T thread.

9+2 AAA gaming games on processor performance test
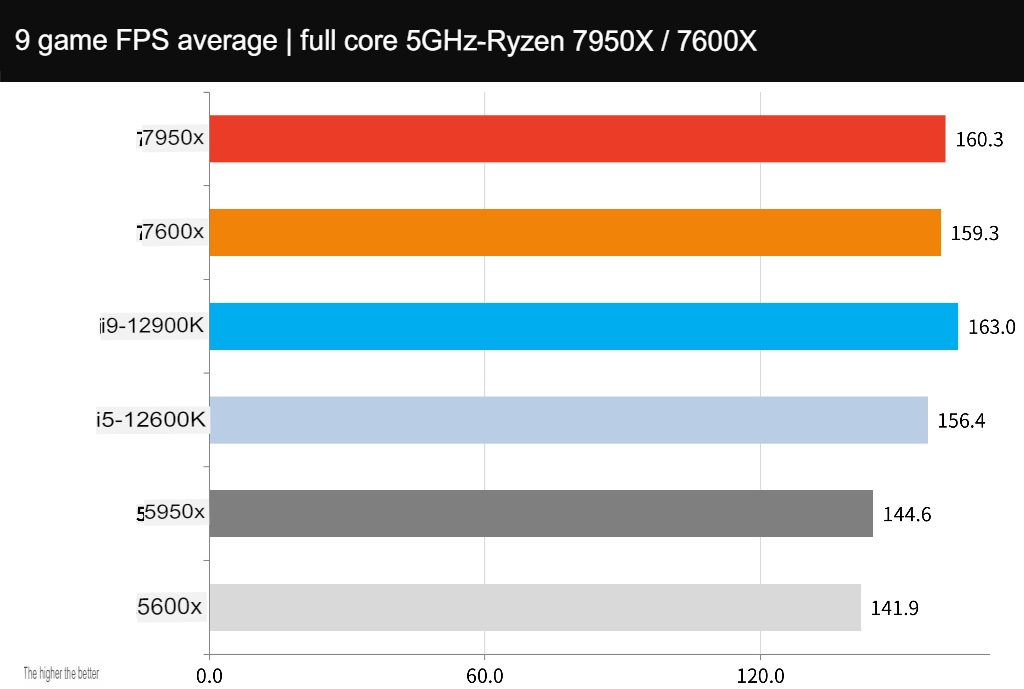
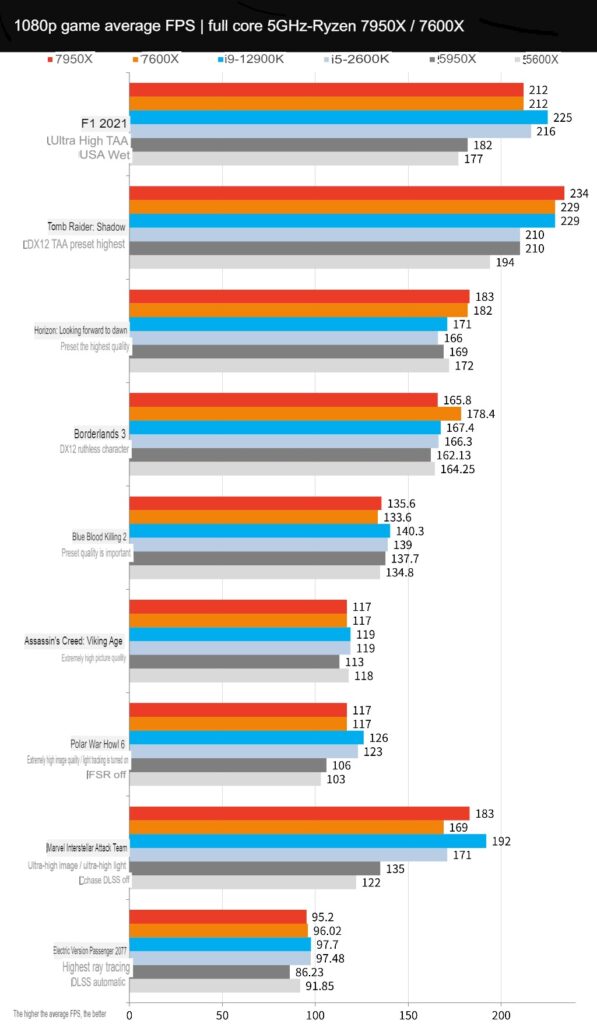
9 AAA game performance tests, including the entry-level “F1 2020” racing game, the adventure “Tomb Raider: Shadow”, “Horizon: Expecting Dawn”, and the performance-heavy “Edge Forbidden 3”, “Blood Killer 2” ”, “Assassin’s Creed: Viking Age”, and games such as “Polar Trench 6”, “Marvel Interstellar” and “Electric Traitor 2077” that support light pursuit.
The tests were conducted with the In-Game Benchmark test at 1080p resolution and the highest default settings of the game. Except for “Dian Yu Ke 2077”, which enabled DLSS acceleration, the rest of the games did not use DLSS or FSR acceleration.
Among the 9 games, the 7950X achieves an average of 160.3 FPS, and the 7600X has a game performance of 159.3 FPS, but slightly loses to the i9-12900K’s 163 FPS, but the good news is that it wins the i5-12600K’s game performance.
Compared with the previous generation 5950X, the 7950X has a 10.9% increase in game performance, while the 7600X is 12.3% more than the 5600X. But on the whole, it is still a small loss to the i9-12900K, so it is difficult to regain the reputation of the strongest game processor.
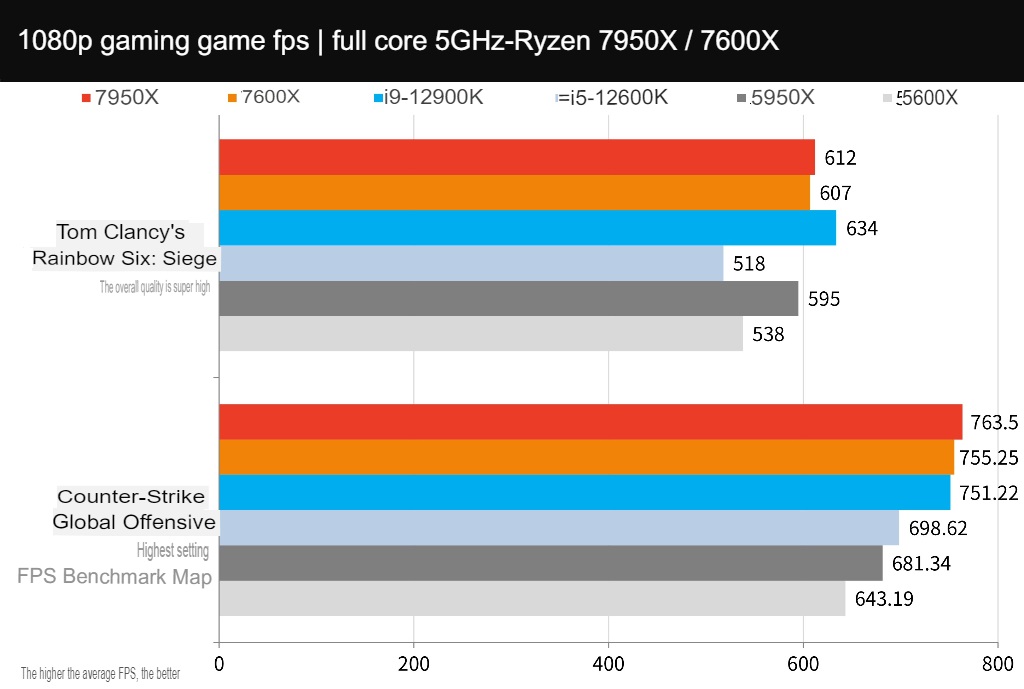
E-sports games focus on the tactical and technical competition between players and teams, so they do not require much picture quality, which also allows such games to have a fairly high average FPS performance on high-end CPUs and GPUs, especially in 1080p resolution. Under the lower speed, the improvement of CPU performance and clock can increase the FPS performance of the game.
The test used two games, “Counter-Strike: Global Offensive” (CS: GO) and “Tom Clancy’s Rainbow Six: Siege” (R6), and tested at 1080p resolution and the highest settings of the game.
CS: GO game 7950X achieves the high performance of 763.5 FPS, 7600X also has 755.5 FPS, even better than i9-12900K’s 751.2 FPS; but R6 is the opposite, 7950X only 612 FPS, slightly lost to i9-12900K’s 634 FPS.
Ryzen 7950X and 7600X processor temperature and power consumption test
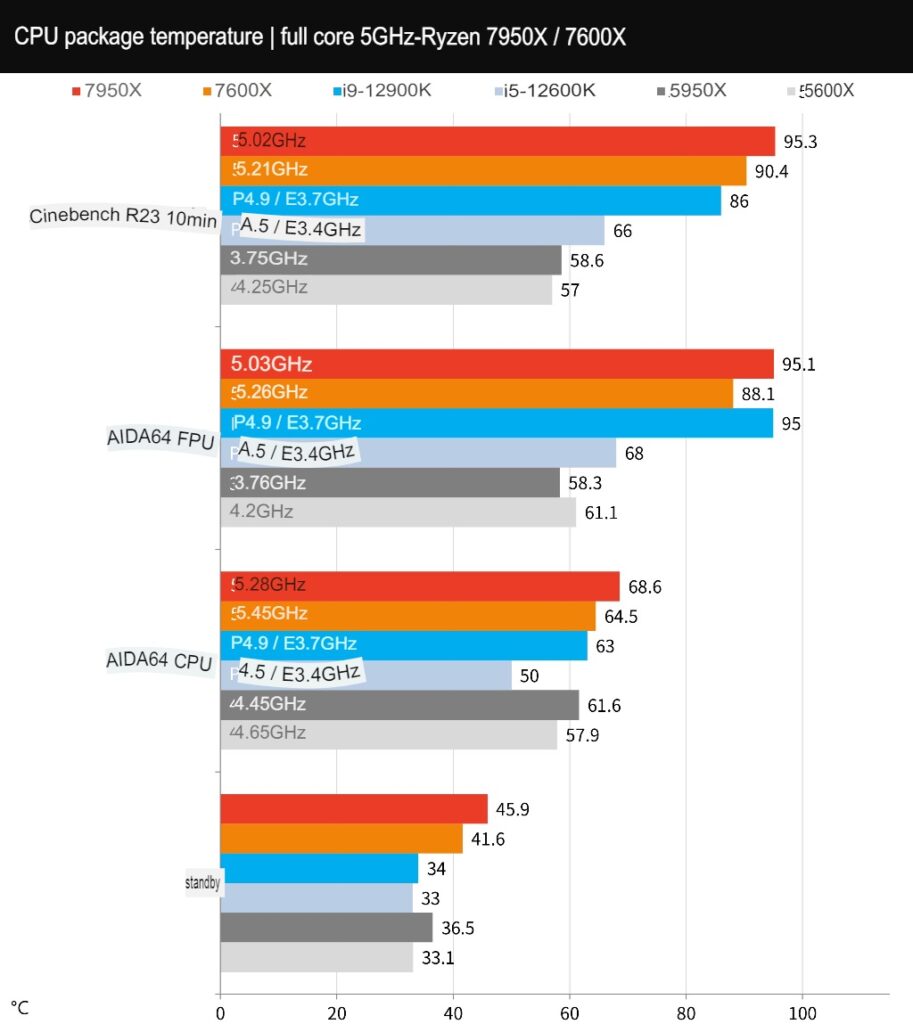
In terms of stress test, the test uses ROG STRIX LC II 280mm water-cooled radiator, fan and water pump with full speed settings, and compares AIDA64 CPU and FPU burn-in respectively; for general computer use, it is relatively close to the temperature performance of AIDA64 CPU test, while FPU test is the highest load with higher power consumption.
The AIDA64 CPU stress test is relatively close to the general computer usage conditions. The 7950X is pressed at 68.6°C at 5.28GHz with all cores, and the 7600X is pressed at 5.45GHz at 64.5°C. This temperature performance is similar to the i9-12900K, which is slightly better than the i5. -12600K high.
Then under the AIDA64 FPU stress test, the 7950X clock slightly lowers the upper limit of the preset TjMAX temperature wall at 5.03GHz at 95.1°C, while the 7600X is at 5.26GHz at 88.1°C; the temperature is comparable to the i9-12900K, but Much higher than the i5-12600K.
The temperature performance of Cinebench R23 is also the same as the above-mentioned FPU under the same test, but the temperature of this generation of 7950X and 7600X has really increased a lot. It is recommended to use it with a water-cooled radiator of 240mm or more.
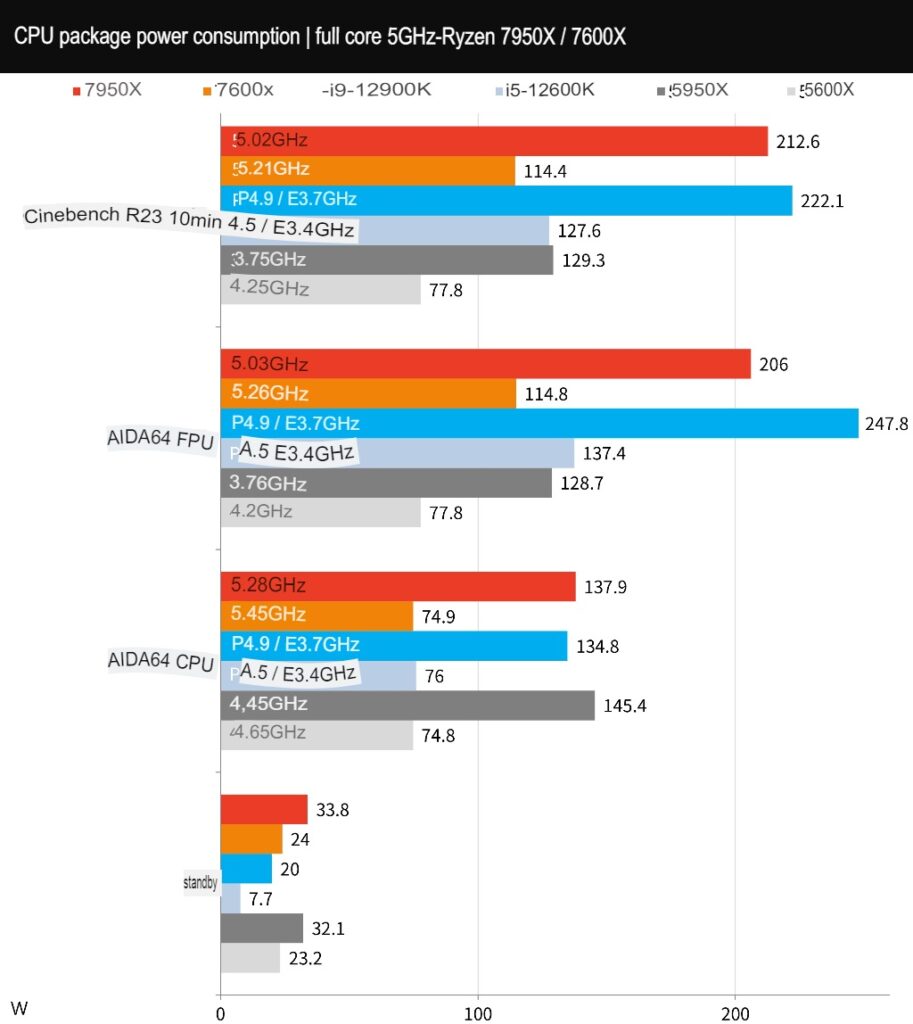
As for the CPU power consumption, it is mainly based on CPU Package Power. Under the AIDA64 CPU test, the 7950X reaches 137W and the 7600X 74.9W, comparing the performance of the i9-12900K and the i5-12600K. Then under the FPU stress test, the 7950X came to 206W, and the 7600X was 114.8W, but it still saves more power than Intel.
In this generation, the temperature and power consumption will increase due to the increase of the clock frequency. Players who choose 7950X and 7900X processors are recommended to reserve at least 300W for the processor and 400W for high-end graphics cards ( Flagship card 500W), at least 850W will be recommended, after all, there is still power for peripherals, RGB, fans, SSD, HDD, etc.
For 7700X and 7600X, the processor is around 200W, and the required power supply specifications are adjusted according to the matching graphics card.
TjMAX is the key to manual overclocking / PBO and Offset makes temperature performance better
This generation of AMD Ryzen 7000 clocks has been greatly improved, and the temperature and power consumption of the processor have also increased a lot. In addition to the X670E’s debut relationship, the Vcore voltage given by various board manufacturers to the CPU is also higher. Therefore, the above mentioned During the temperature test, the 7950X will run under the temperature wall of 95°C. It is recommended that players first try the “Offset” setting to reduce the Vcore voltage, and find a better balance between performance and temperature by reducing the voltage.
For example, after setting the Vcore Offset -0.07v on the 7950X at hand, it maintains the full-core 5GHz clock in the Cinebench R23 test, but the temperature is only 87-88°C to complete the test. However, after turning on the PBO or +200 PBO automatic overclocking function after depressurizing, the clock still cannot be increased by itself under the same test, which may have to wait for a more stable BIOS after the launch to test. (Or change to a better water cooler.)
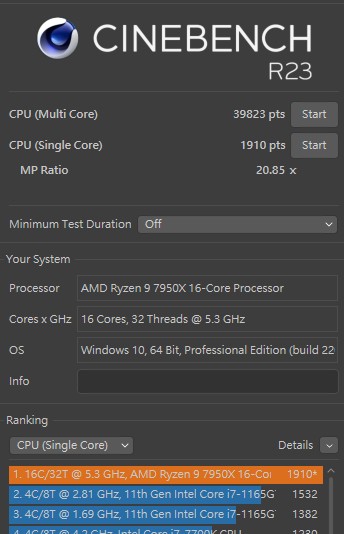
In terms of manual overclocking, the 7950X can reach the overclocking settings of all-core 5.3GHz and 1.29v L5, and test the CPU nT 39823 pts and 1T 1910 pts through Cinebench R23. However, for the 7950X’s single-core 5.7GHz Boost, it’s good to use PBO for overclocking.
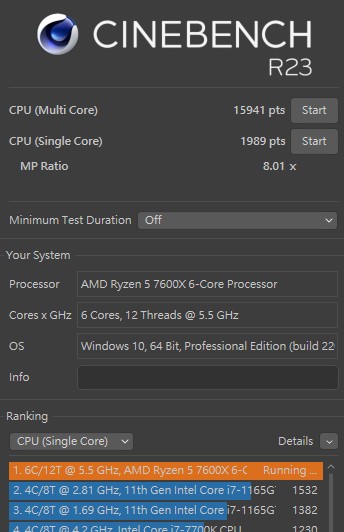
As for the 7600X, the default Vcore voltage is higher in the same situation. After the same Vcore Offset -0.07v, the Cinebench R23 test can maintain the full-core 5.2GHz, 80°C temperature, which is about 10°C lower than the full default. temperature. On the other hand, the 7600X can achieve full-core 5.5GHz, 1.29V L5 to pass the test, and achieve CPU nT 15941 pts, 1T 1989 pts.
For the 7600X, the default 4.7GHz / Boost 5.3GHz, all-core 5.2GHz default, manual all-core overclocking is indeed a good choice, and the 5.5GHz temperature can also be pressed at 81°C during the test, it can be seen that the clock Putting it at 5.3GHz can also have a stable and higher than default multi-core and single-core performance improvement.
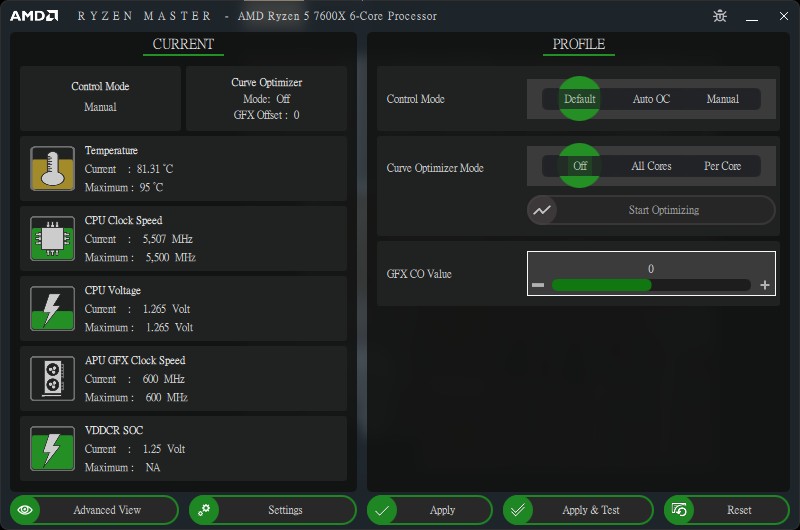
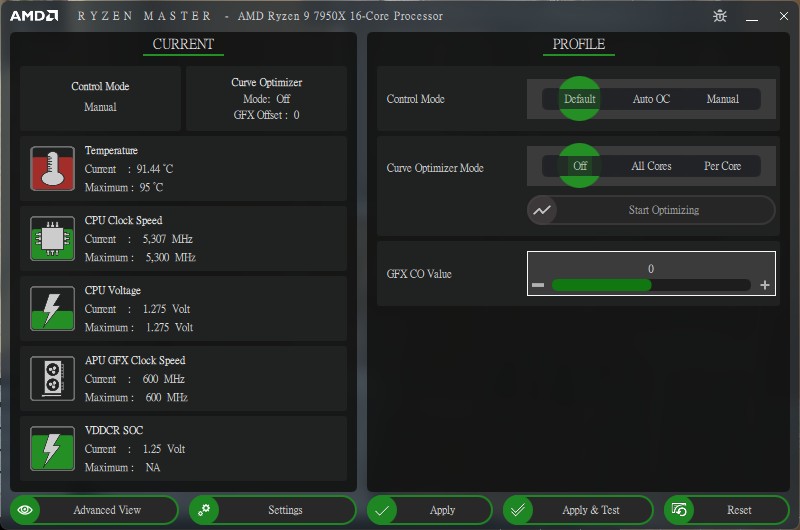
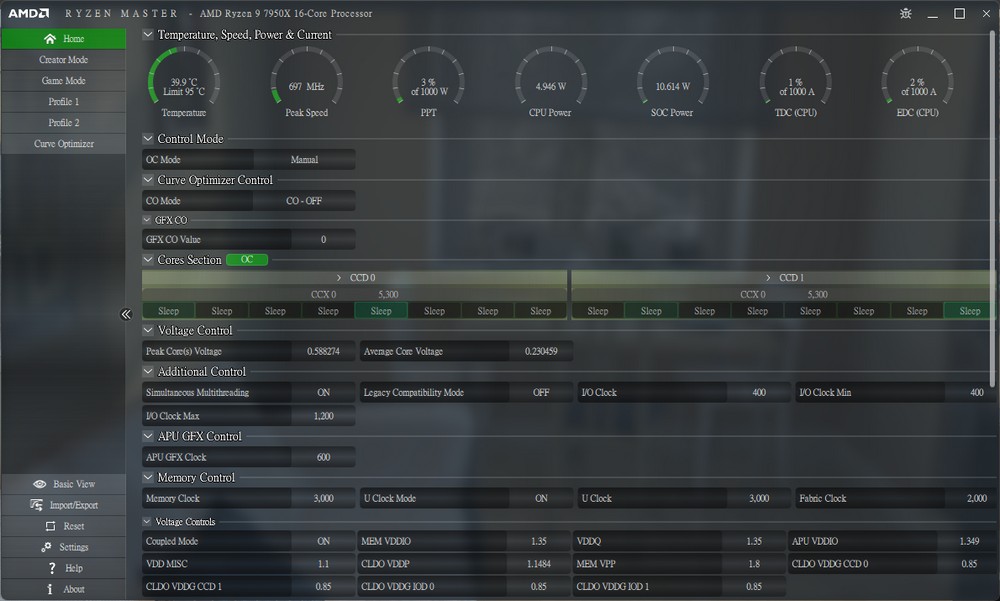
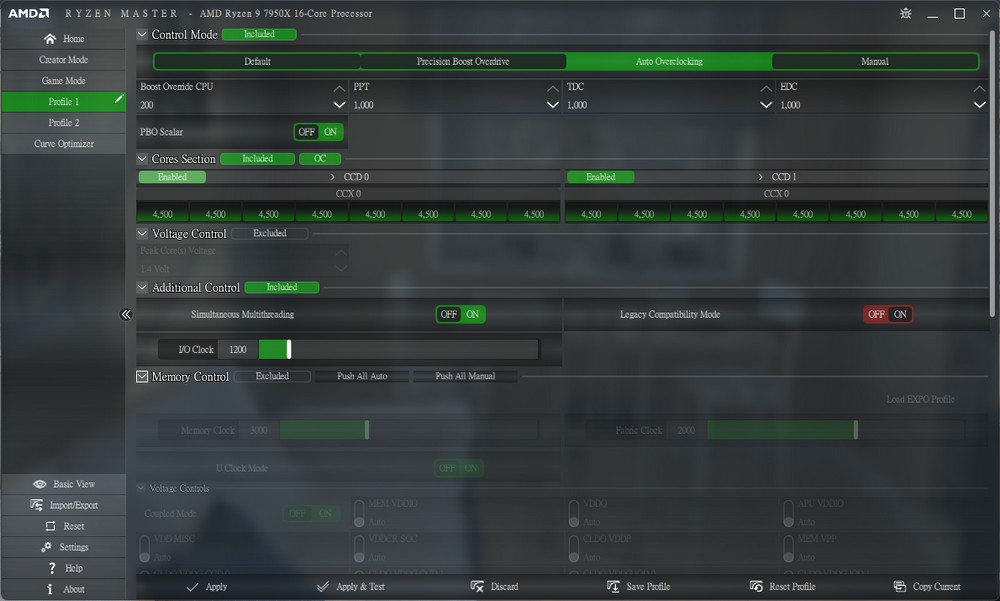
Players can also overclock the Ryzen 7000 processor through Ryzen Master, including preset, PBO, Auto Overlocking and manual control modes, and overclocking the clock, voltage, and memory of each core. Complete monitoring of Ryzen processor information.
Summarize
The new-generation AMD Ryzen 7000 processor provides players with a higher clock performance upgrade. The 7950X full-core 5GHz, single-thread 5.7GHz Boost high clock, compared to the previous generation 5950X processor, has a 50% performance improvement in multi-core computing, The single core also has a 22% acceleration, the overall computer performance is 20%, and the game performance is 10%. The overall upgrade performance is quite impressive.
This also allows the Ryzen 9 7950X to beat the i9-12900K in multi-core computing, rendering and computer performance tests. Although a small loss in game performance cannot regain the name of the strongest game processor, it will eventually regain the strongest performance in this wave of multi-core wars. The name of the processor, but the real enemy of this generation is the i9-13900K that has not yet been launched, which also makes this wave of multi-core wars continue until mid-October.
On the other hand, the Ryzen 5 7600X also has a good upgrade, but in the face of the i5-12600K with more cores, it fails in the multi-core computing and rendering tests, but regains 10% in the overall computer performance and game performance. This means that when the 7600X and 7700X face the 13th generation Intel processors in the future, they may also maintain such a five-to-five wave of winning and losing.
The AM5 slot brings the new X670 and B650 platforms, with X670E / B650E for PCIe 5.0 graphics card and SSD expansion, and X670 / B650 for PCIe 5.0 SSD expansion. Judging from the above specifications, this generation of boards starts with at least 3 M.2 and 1 USB 20Gbps high-speed external connection, while the flagship model has up to 5 M.2, 2 USB4 and up to 23 USB ports. question.
After all, the previous generation X570 has undergone multiple generations of processor updates. Until now, it has switched to the new X670 and B650 platforms. The overall I/O specifications will definitely be doubled, but the relative price will also rise with the tide, but AMD has promised that AM5 will continue to It will be used until 2025, so it is definitely worthwhile to buy a high-end, flagship motherboard for the AMD platform.
At the same time as the Ryzen 7000 clock is increased, the temperature and power consumption of the processor are also relatively increased. It is recommended to use a water-cooled radiator of more than 240mm, and the power supply is matched according to the level of the graphics card, but the high-core 7950X and 7900X are at least 300W, while The 7700X and 7600X have at least 200W of space for the processor. In addition, after adding the power consumption of the graphics card, you can grab 100W or more for peripheral FAN, RGB, HDD and other devices.
Clock upgrades, performance upgrades, and major platform updates. This generation of Ryzen 7000 is indeed powerful. However, in the case of upgrading the CPU together with the entire set of motherboards and DDR5 memory, the Taiwanese price of Ryzen processors is also relatively important. Consideration After the US dollar price and the price of market competitors, whether the Ryzen 7000 can be popular again depends on the first wave of pricing.
The first 4 Ryzen 7000 processors and X670 motherboards will go on sale at 21:00 on 9/27, while the mainstream B650 will have to wait until mid-October.
As for the final battle of this year’s multi-core war, we will have to wait until mid-October to compete again.
Please share this article with your friends on social media, and help you know the test result of the 5.7GHz breakthrough! AMD Ryzen 7950X and 7600X test report / clock leap into a new generation.
This article is based on the personality of the reviews. You are responsible for fact-checking if the contents are not facts or accurate.
Title: 5.7GHz breakthrough! AMD Ryzen 7950X and 7600X test report / clock leap into a new generation