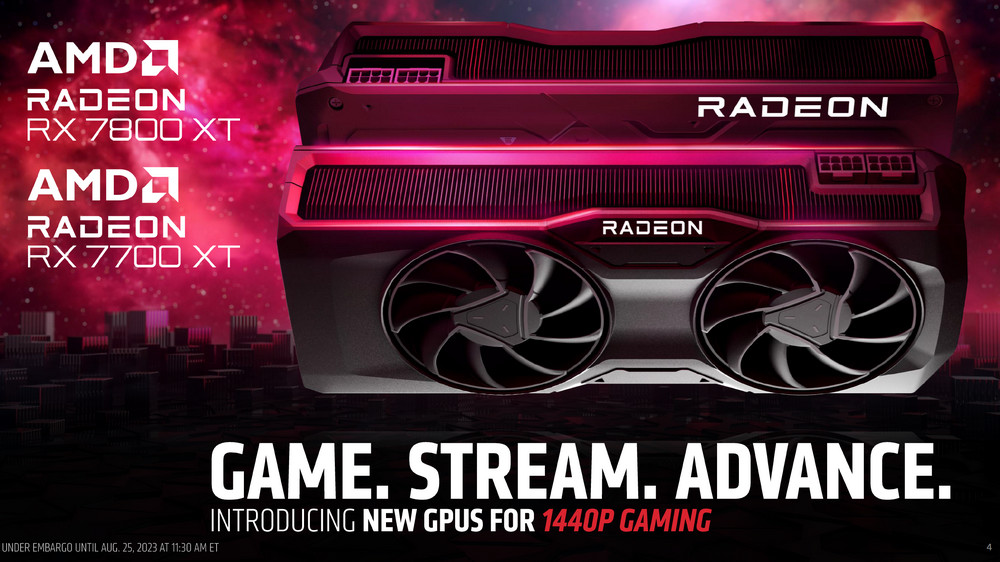
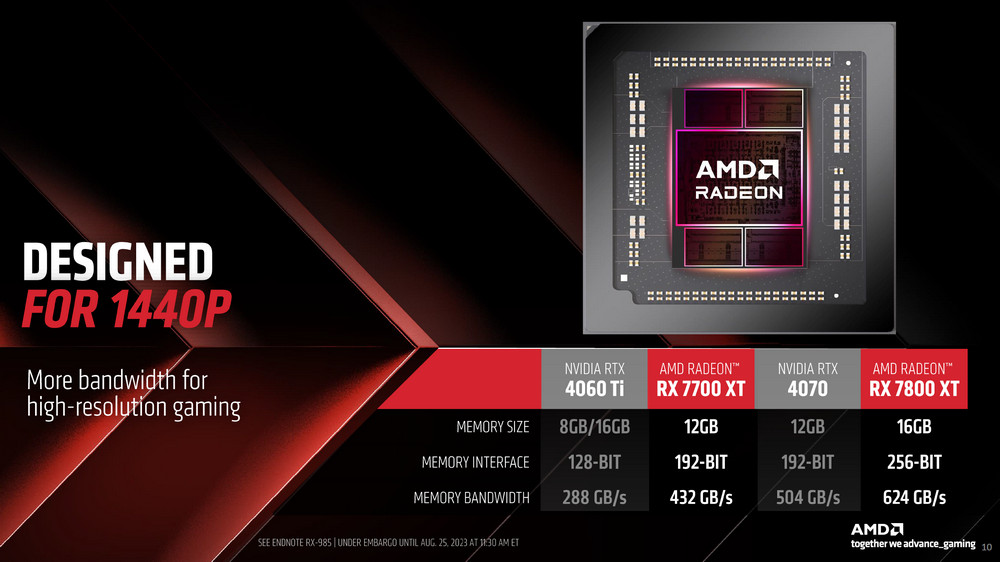
The AMD RDNA 3 series introduces two new graphics cards optimized for 1440p gaming: the AMD Radeon RX 7800 XT and Radeon RX 7700 XT. Priced at NT$ 17,590 and NT$ 15,790 in Taiwan, they aim to cater to gamers focused on 2K QHD resolution, be it e-sports or AAA titles. However, with FSR 3 not launching alongside them, gamers might want to hold off on ray-tracing games for now. Their primary competitors are the RTX 4070 and RTX 4060 Ti. To see if these two new additions stand out, we’ll examine their performance across 24 games.
The RDNA 3 generation 2K gaming cards RX 7800 XT and RX 7700 XT are here, but FSR 3 is almost ready
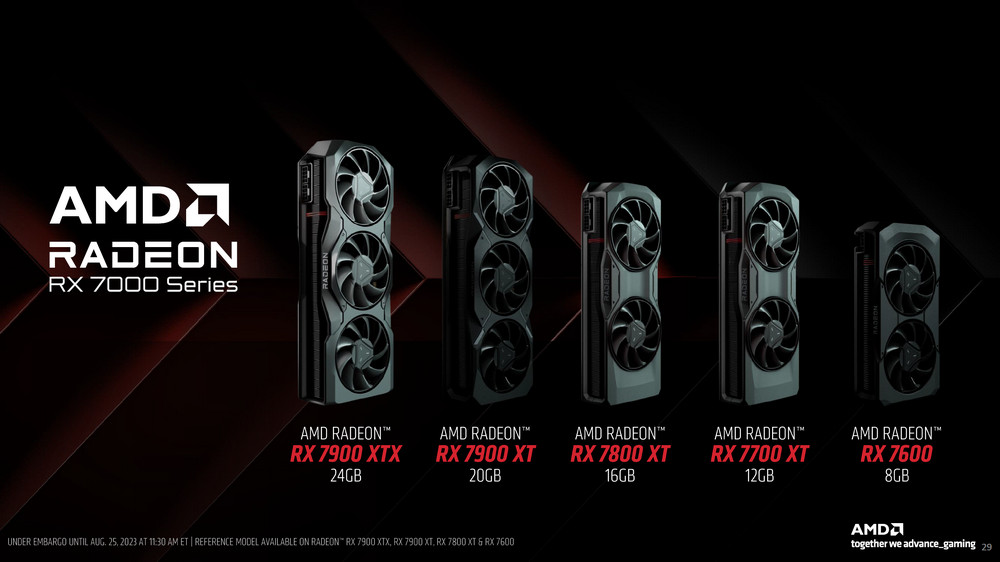
The AMD RDNA 3 GPU architecture has enhanced its CU compute unit, integrated an AI accelerator, and incorporated a second-generation ray tracing unit. Additionally, it supports advanced Dual Media / Radiance Display engines with HDMI 2.1a, DP 2.1 outputs, and the AV1 codec among other features. The top-of-the-line Radeon RX 7900 XTX and RX 7900 XT promise gaming at 4K with 100 frames per second. However, five months after these flagships were introduced, AMD released the 1080p beginner-friendly Radeon RX 7600 8GB. Later, during this year’s Gamescom, the test subjects of our review, the “AMD Radeon RX 7800 XT and RX 7700 XT”, were unveiled. These cater to the mainstream gaming audience aiming for 2K QHD resolution, and there’s anticipation that the FSR3 acceleration tech will be launched shortly.
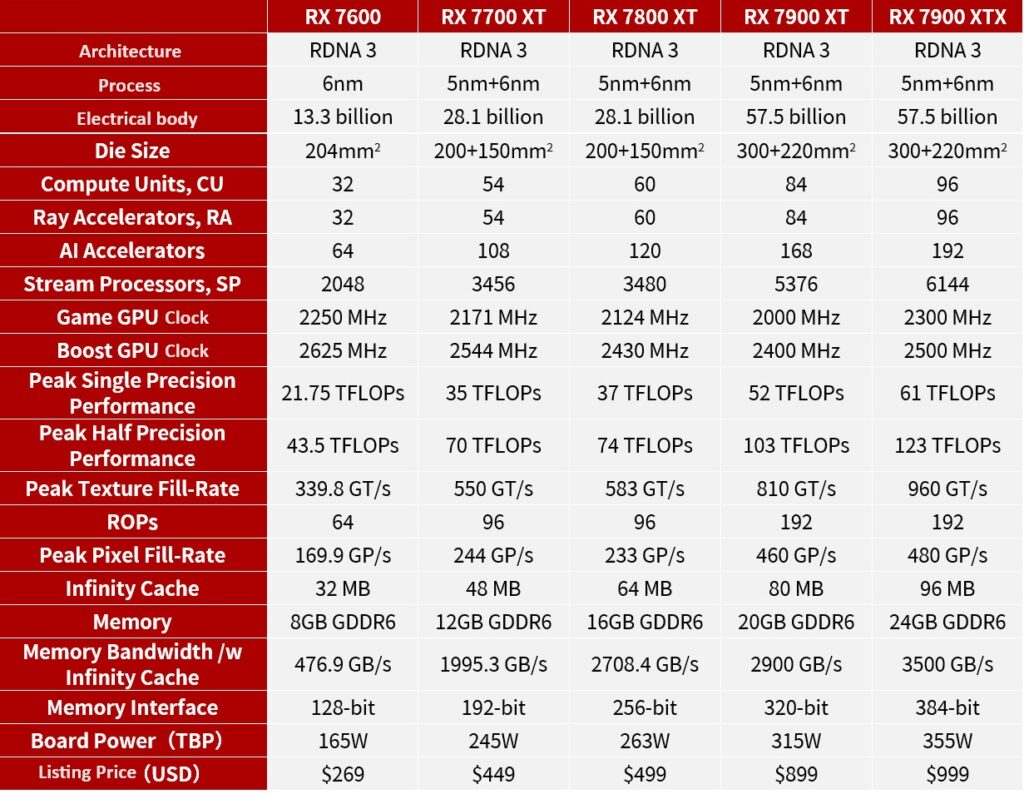
The AMD Radeon RX 7800 XT features 60 compute units, 3,480 SP stream processors, 60 RA ray tracing units, and 120 AI accelerators. It operates at a GPU clock speed of 2,124 MHz with a boost of 2,430 MHz. It’s equipped with 16GB GDDR6 memory alongside a 64MB Infinity Cache. The card has a TBP (total board power) of 263W and is priced at US$499. The expected price in Taiwan is approximately NT$17,590.
On the other hand, the Radeon RX 7700 XT comes with 54 compute units, 3,456 SP stream processors, 54 RA ray tracing units, and 108 AI accelerators. Its GPU clock speed stands at 2,171 MHz with a boost up to 2,544 MHz. This model is loaded with 12GB GDDR6 memory and a 48MB Infinity Cache. Its TBP is designated at 245W, and it’s priced at US$449. In Taiwan, this might translate to around NT$15,790.
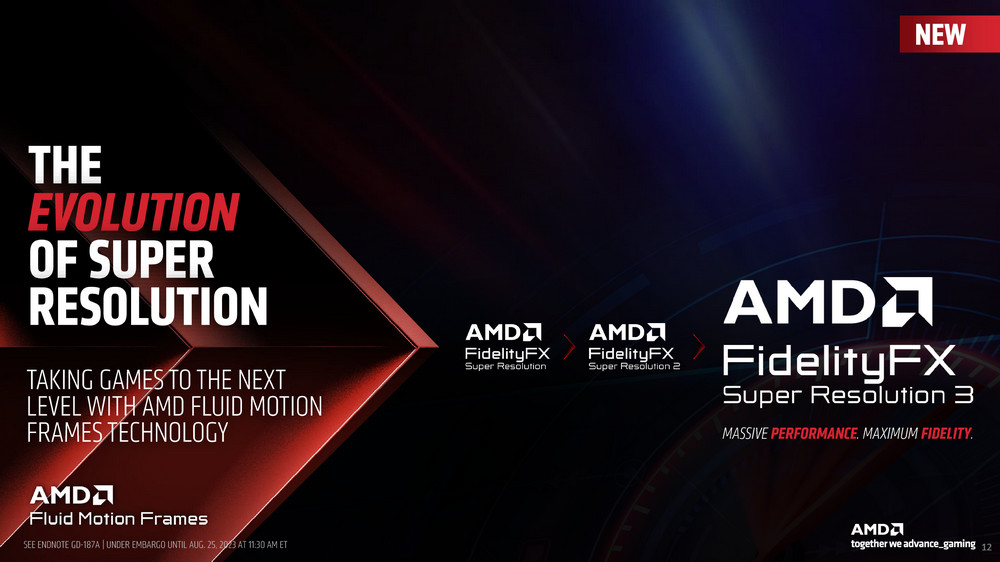
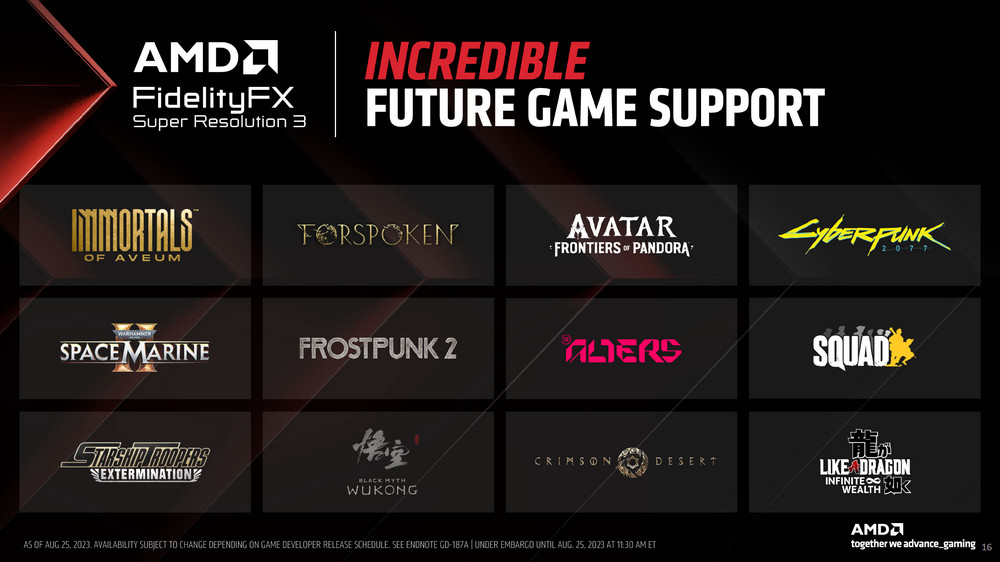
Many gamers are eagerly anticipating AMD’s FidelityFX Super Resolution 3 (FSR3) acceleration technology. This tech amalgamates the features of Super Resolution Upscaling for enhanced resolution, AMD Fluid Motion Frames for frame interpolation, and Anti-Lag for reduced latency, aiming to deliver significant performance boosts.
While AMD’s FSR 3 acceleration tech will be compatible with various GPUs, the exact release date remains unclear. What is certain is its debut in games like “FORSPOKEN” and “Immortals of Aveum.” Furthermore, titles like “Avatar 2077,” “Avatar: Pandora’s Frontier,” and “Black Myth: Wukong” will also integrate this technology. The specific timeline for this integration will be disclosed by AMD in due course.

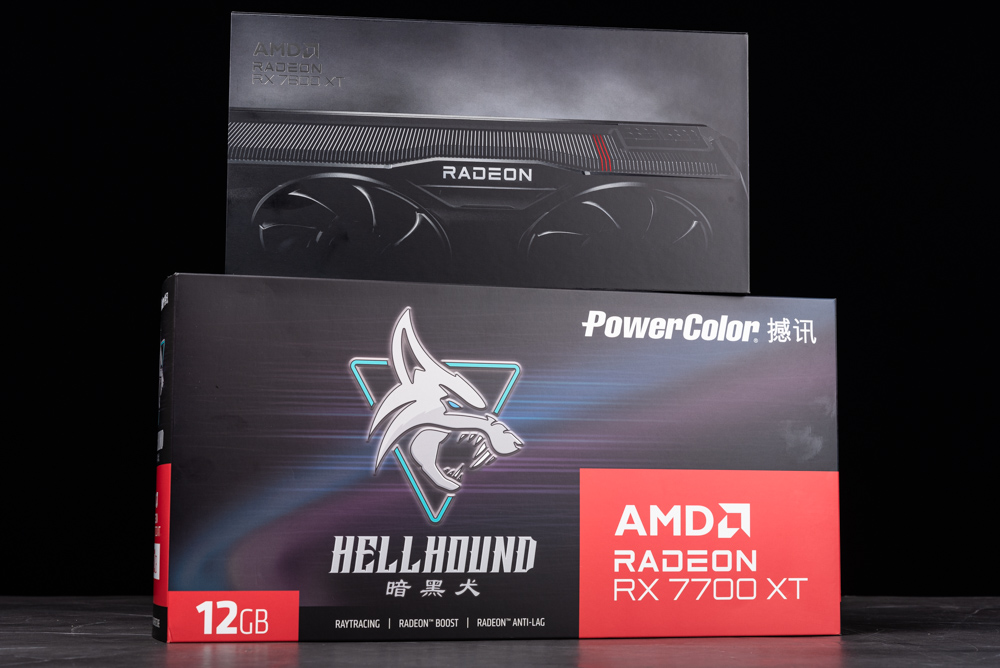
AMD Radeon RX 7800 XT and RX 7700 XT unboxing
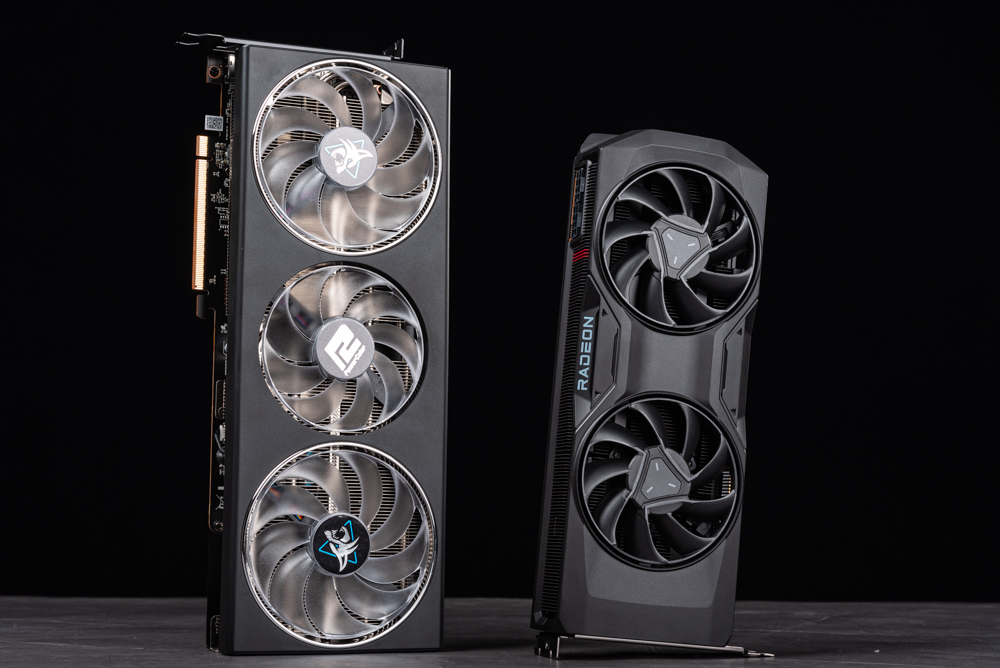
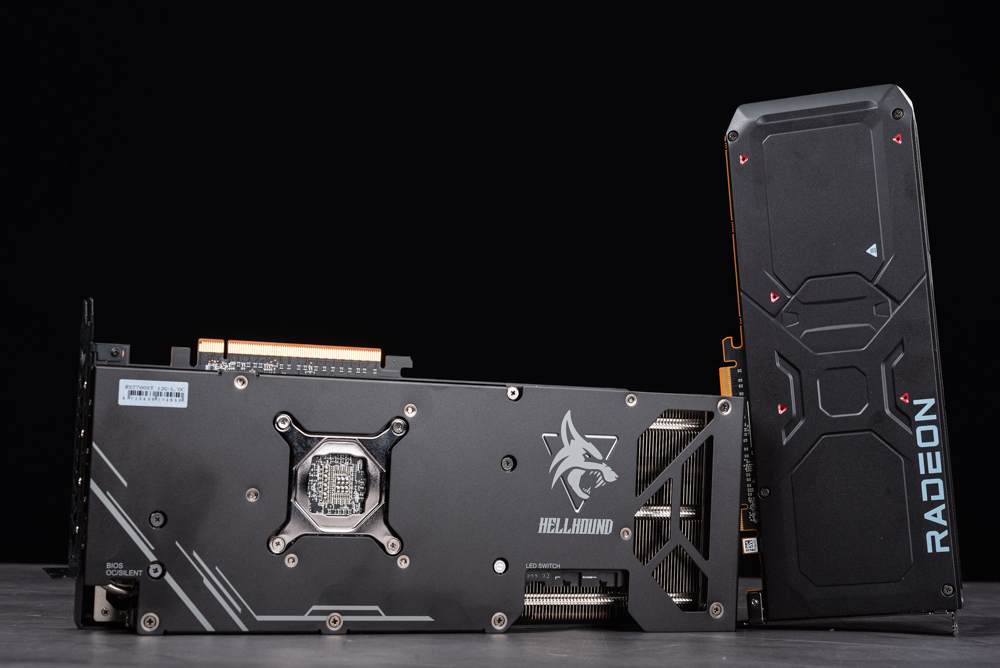
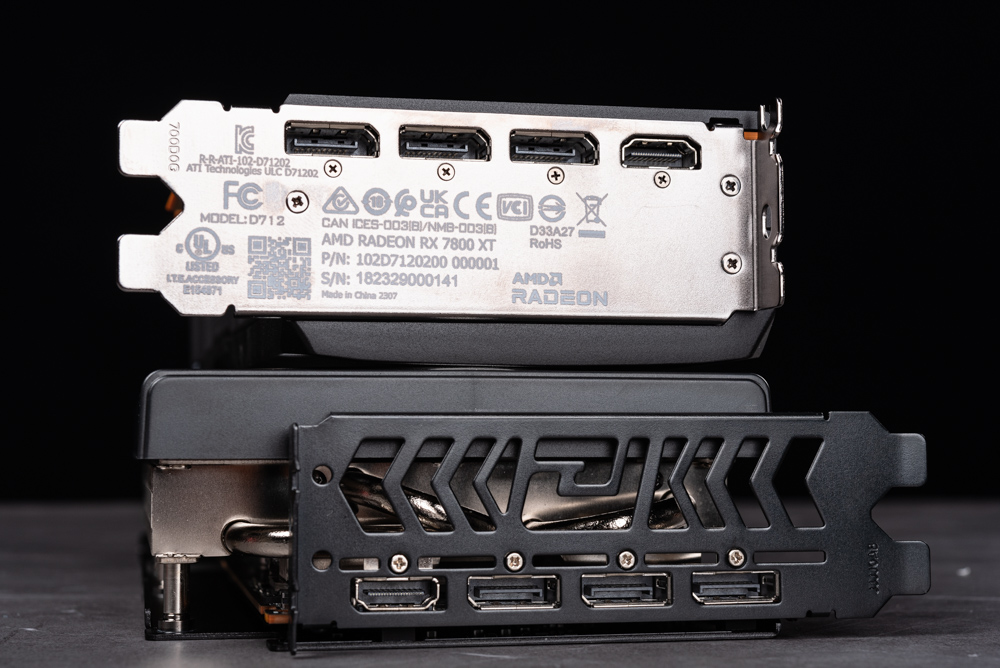
In this evaluation, we’re examining the AMD Radeon RX 7800 XT reference card, which employs a dual-axial fan cooler. Its size mirrors that of the RX 7900 series. Additionally, we’re testing the PowerColor HellHound variant of the RX 7700 XT. Although this custom card offers superior cooling capabilities, its power consumption is notably higher than the default AMD specification.
The standard edition of the Radeon RX 7800 employs a heat pipe to direct the excess heat towards the fins, with a fan aiding in cooling the GPU.
For the PowerColor HellHound RX 7700, a 6mm heat pipe is used to channel the waste heat to the cooling fins, offering superior heat dissipation compared to the reference model.
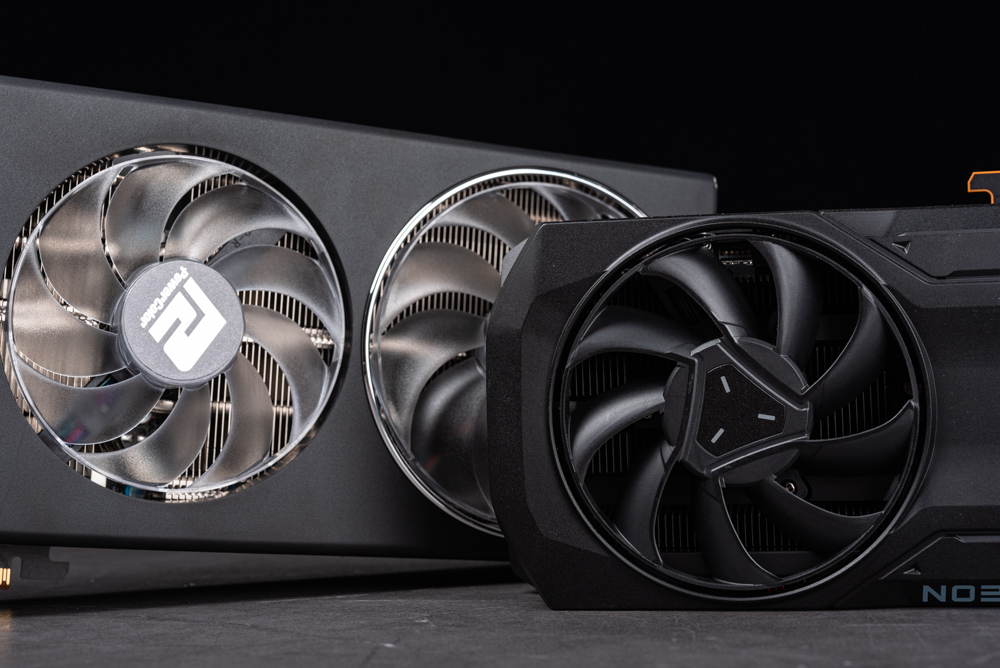
Regarding power requirements, both the standard RX 7800 XT and the custom PowerColor HellHound RX 7700 XT cards need two PCIe 8-pin connectors. Additionally, both feature metal backplates to reinforce the structure of the graphics card.
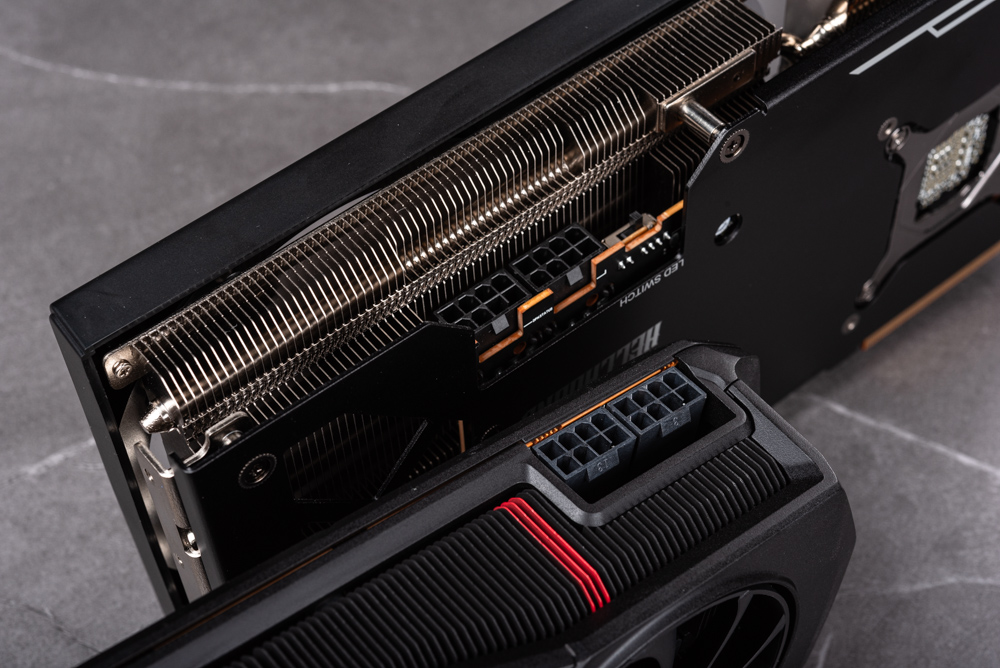
For output options, it offers 1 HDMI 2.1a and 3 DisplayPort 2.1 ports, allowing for a combined total of up to 4 display outputs.
AMD Radeon RX 7800 XT and RX 7700 XT creation and rendering performance test
Test Overview:
This evaluation encompasses tests on creative software like DaVinci Resolve 18, Photoshop, and Lightroom. For gaming, we measure performance in e-sports, AAA titles, and ray-tracing games at resolutions of 1440p and 1080p, complete with all special effects. This includes testing for FSR and other related metrics. We’ve also compared the performance with RTX 4070 and RTX 4060 Ti to provide gamers with comprehensive data for reference.
Testing Platform:
- Processor: AMD Ryzen 9 7950X
- Motherboard: ASUS ROG CROSSHAIR X670E HERO
- Memory: G.SKILL DDR5-6000 (16GBx2)
- Graphics Cards: AMD Radeon RX 7800 XT, RX 7700 XT, RTX 4070, RTX 4060 Ti
- System Drive: Solidigm P44 Pro 1TB PCIe 4.0 SSD
- Cooling: ROG RYUJIN III 360
- Power Supply: Seasonic VERTEX GX-1000
- Operating System: Windows 11 Pro 21H2 64bit (Resizable BAR On)
- Driver Versions: AMD Adrenalin 23.20.01.05 / NVIDIA 537.13
Graphics Card Specifications:
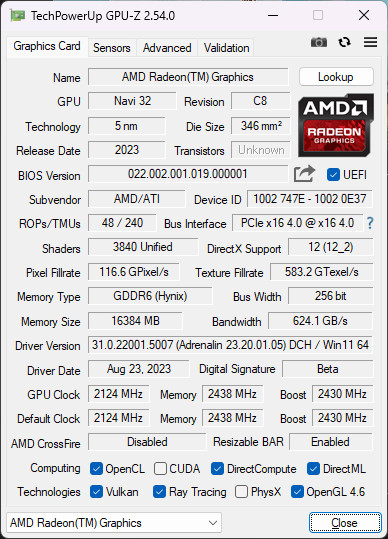
- AMD Radeon RX 7800 XT:
- GPU: 5nm process Navi 32 with 3,840 rendering cores
- Memory: 16,384 MB GDDR6 (Hynix)
- Clock Speed: Default at 2,124 MHz with a Boost up to 2,430 MHz
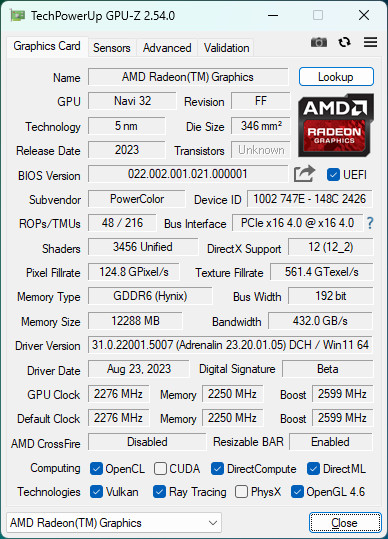
- AMD Radeon RX 7700 XT:
- GPU: Navi 32 with 3,456 rendering cores
- Memory: 12,288 MB GDDR6 (Hynix)
- Clock Speed: Default at 2,276 MHz with a Boost up to 2,599 MHz
Note: The current driver version has an issue where GPU-Z is unable to correctly identify the GPU model.
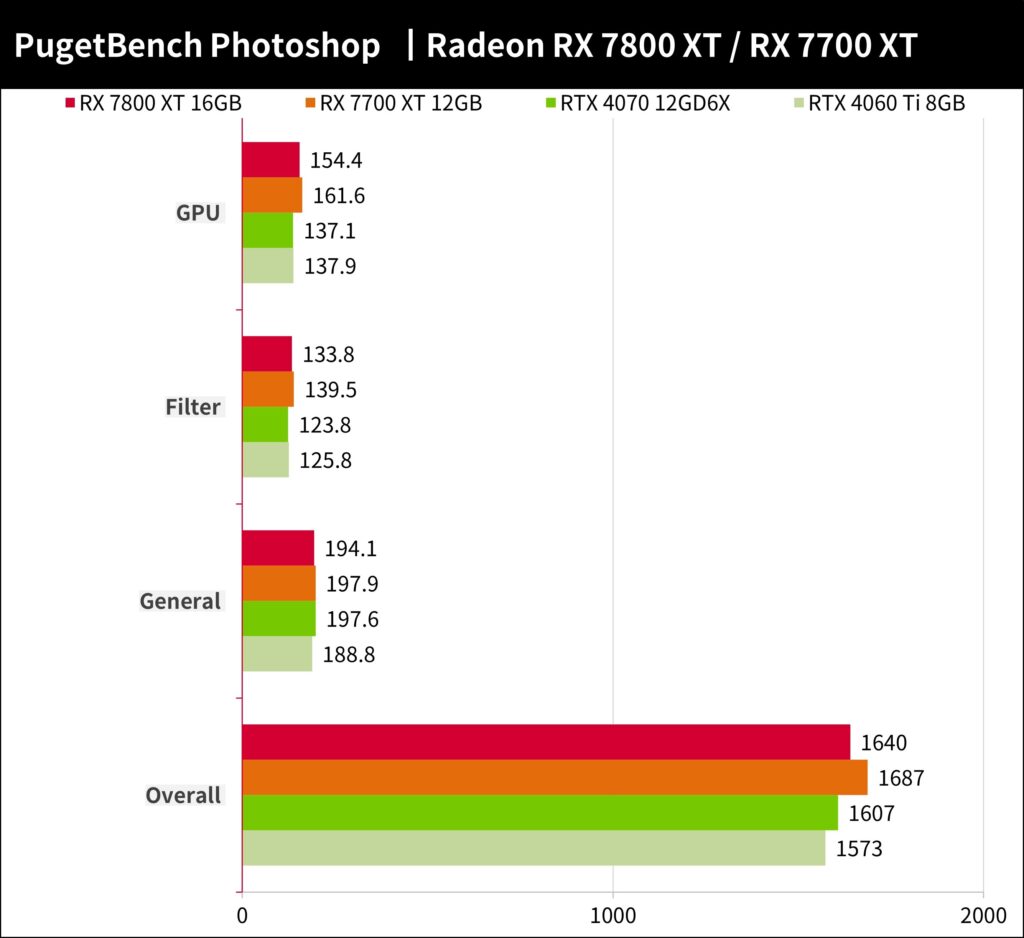
The PugetBench for Photoshop benchmark evaluates commonly utilized Photoshop features and is segmented into “General” and “Filter” tasks. The “General” tasks involve operations on 18MP.CR2 RAW photos, such as resizing to 500MB, rotation, selections with the magic wand, Mask Refinement, and others like Content-Aware Fill, and both saving and opening. PSD files. Meanwhile, the “Filter” task tests feature like the Camera Raw Filter, noise reduction, and adaptive wide-angle, among others. Each test is run three times, with scores scaled to a maximum of 1000 points, where a higher score indicates better performance.
The RX 7800 XT scored 1640 points, while the RX 7700 XT achieved 1687 points. Both GPUs displayed strong performance scores. In a direct comparison, the RX 7800 XT outperformed the RTX 4070 by around 2%, and the RX 7700 XT surpassed the RTX 4060 Ti by approximately 7%.
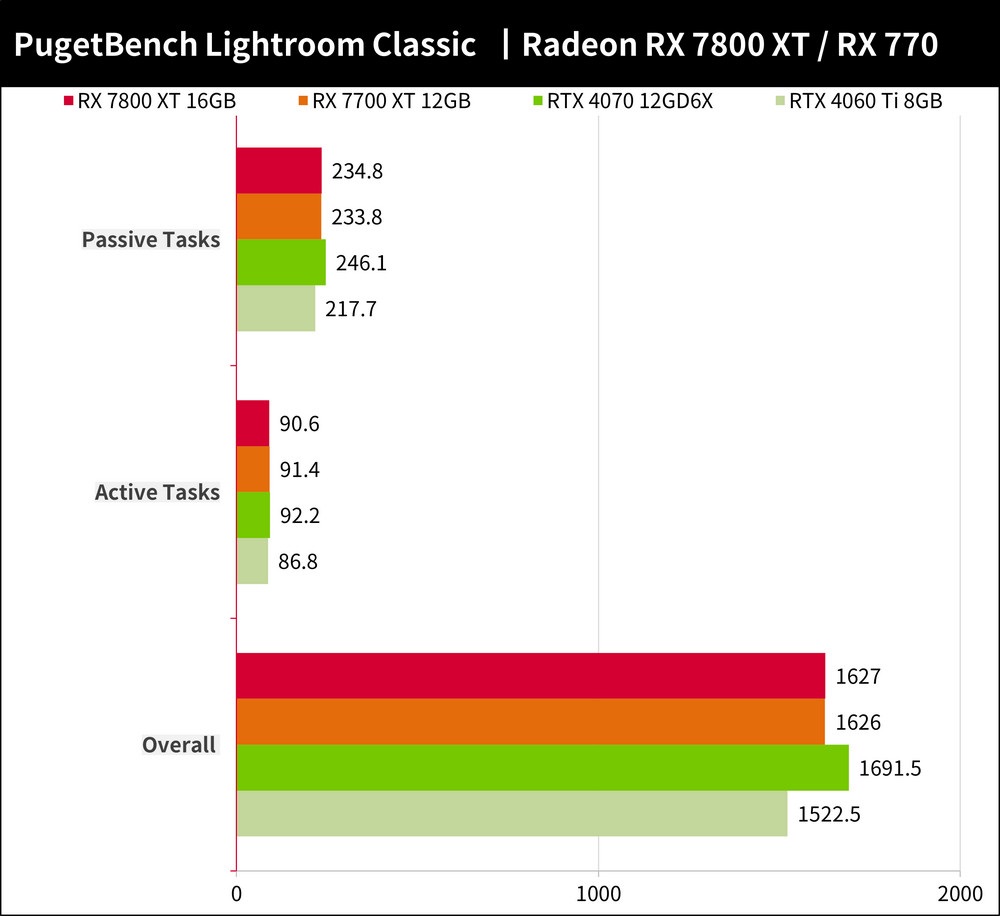
The PugetBench for Lightroom Classic benchmark sets up a library containing 500 photos from cameras like the Canon EOS 5D Mark III, Sony a7r III, and Nikon D850. The main aim of the active task is to assess the performance when enlarging the Lightroom photo library, switching between images, and auto white balance/tone adjustments. The passive task, on the other hand, evaluates importing 500 photos, creating a smart preview, merging panorama and HDR, and outputting files in JPEG and DNG formats, among other operations. Scores are capped at 1000 points, with higher scores indicating superior performance.
The RX 7800 XT scored 1627 points, narrowly surpassing the RX 7700 XT’s 1626 points. Their performances are nearly identical, though the RTX 4070 took the lead in this round. When comparing overall results, the RX 7800 XT was about 4% behind the RTX 4070, while the RX 7700 XT outperformed the RTX 4060 Ti by approximately 7%.
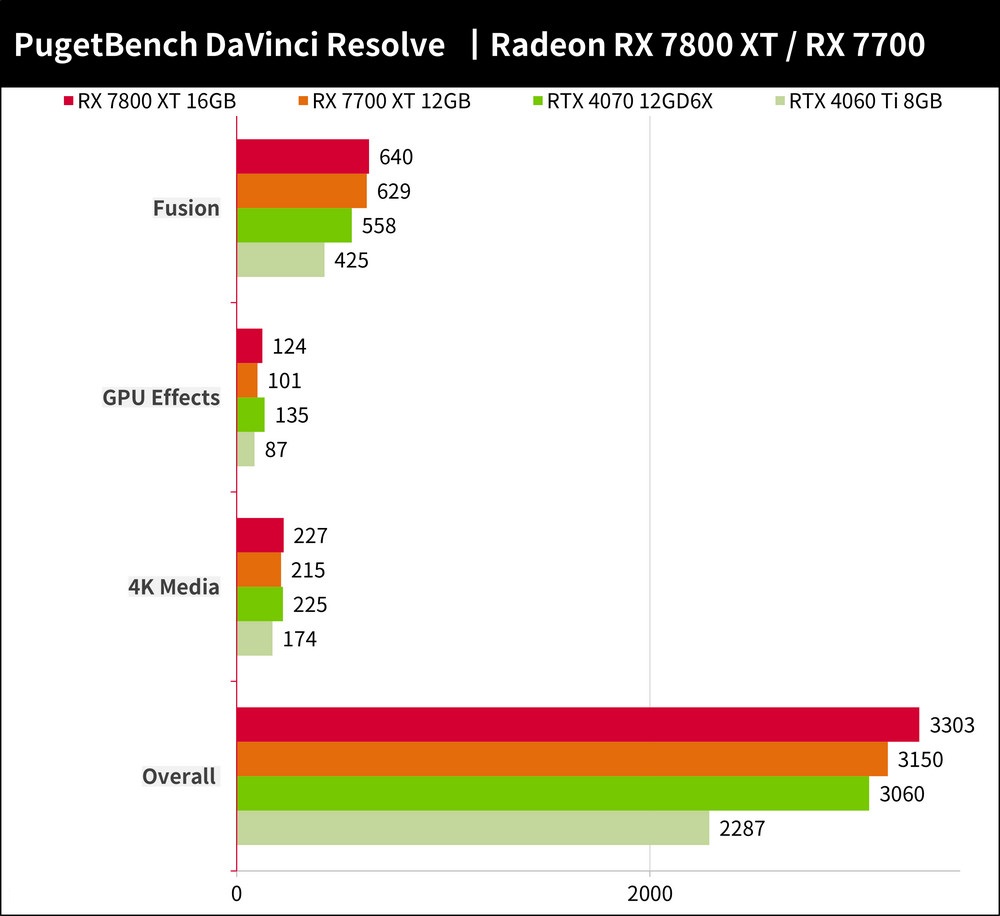
The PugetBench for DaVinci Resolve evaluates 4K and 8K video performance using various media types like 4K H.264, 4K ProRes 422, 4K RED, 8K H.265, and 8K RED. It further assesses a computer’s audio-visual production capabilities through GPU-specific effects such as OpenFX and Fusion.
The RX 7800 XT recorded a score of 3303 points, while the RX 7700 XT posted 3150 points. The variance in GPU performance was most noticeable in the GPU Effects and Fusion benchmarks. In a comparative analysis, the RX 7800 XT surpassed the RTX 4070 by around 8%, while the RX 7700 XT outdid the RTX 4060 Ti by a substantial 38%. Graphics cards with only 8GB of VRAM appeared to be at a disadvantage in this test.
AMD Radeon RX 7800 XT and RX 7700 XT – nod-ai/SHARK generated AI image test
nod-ai’s SHARK is an advanced Machine Learning Distribution designed using the Vulkan API. It’s compatible with various machine learning models. In this particular test, the “Stable Diffusion” text was used to produce images. For specific test instructions and configurations, refer to the provided guide. An important note: these tests utilized the AMD Ryzen 9 7950X processor. The results may slightly vary if tested with the i9-13900K.
The performance was measured by the time taken to produce an image on the third run. The RX 7800 XT was able to generate an image in just 3.44 seconds, while the RX 7700 XT completed the task in 3.8 seconds. In contrast, the RTX 4070 finished the job in 5.2 seconds. Due to VRAM limitations, the RTX 4060 Ti 8GB had to operate in Low VRAM mode, causing its completion time to shoot up to 14.11 seconds.

AMD Radeon RX 7800 XT and RX 7700 XT – 3DMark Benchmark Performance Test
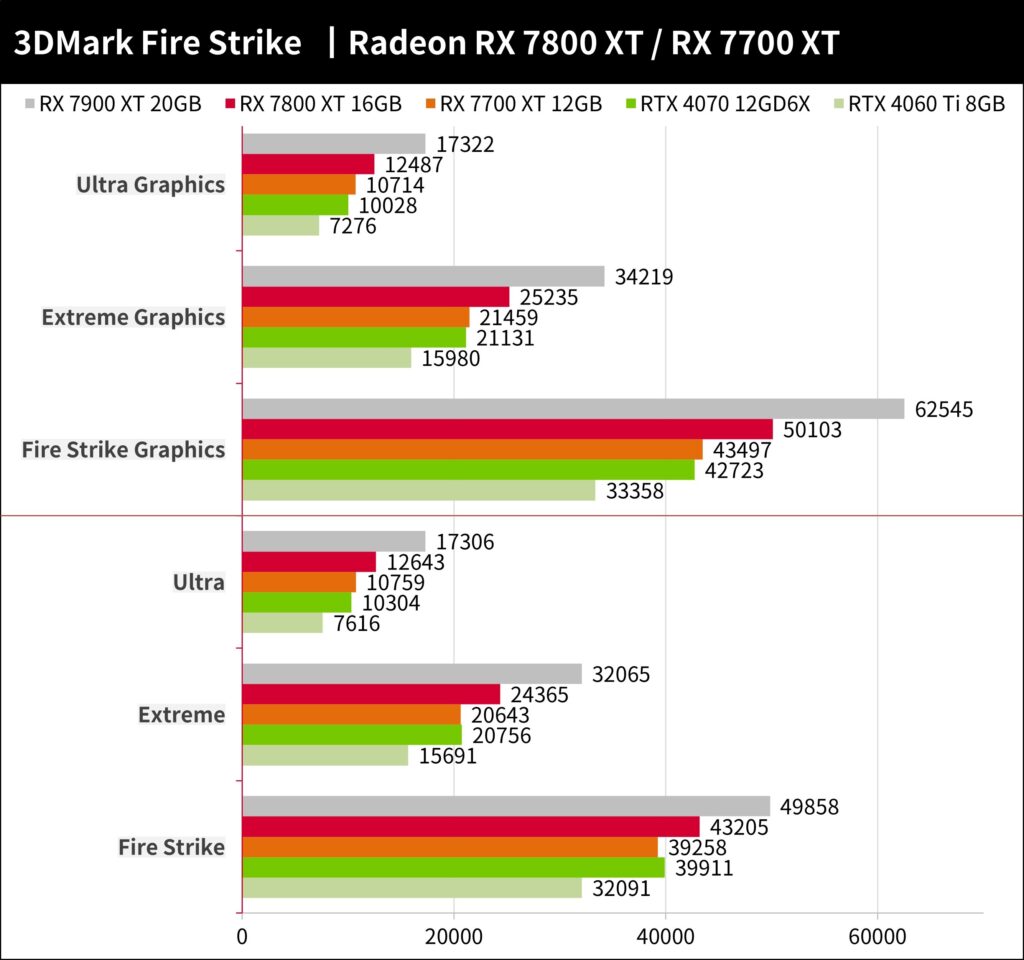
The 3DMark Fire Strike test, based on the older DirectX 11 API, is primarily used to gauge the performance levels typical of earlier games. This benchmark evaluates at three resolutions: 1080p, 1440p (Extreme), and 2160p (Ultra), and it provides individual graphics scores for clarity.
For the RX 7800 XT, the scores were as follows: 50103 points in Fire Strike, 25235 in Extreme, and 12487 in Ultra. Meanwhile, the RX 7700 XT posted scores of 43497 in Fire Strike, 21459 in Extreme, and 10714 in Ultra. Comparatively, the RX 7800 XT’s graphical performance is about 20% superior to the RTX 4070. Additionally, the RX 7700 XT holds a notable 37% lead over the RTX 4060 Ti.
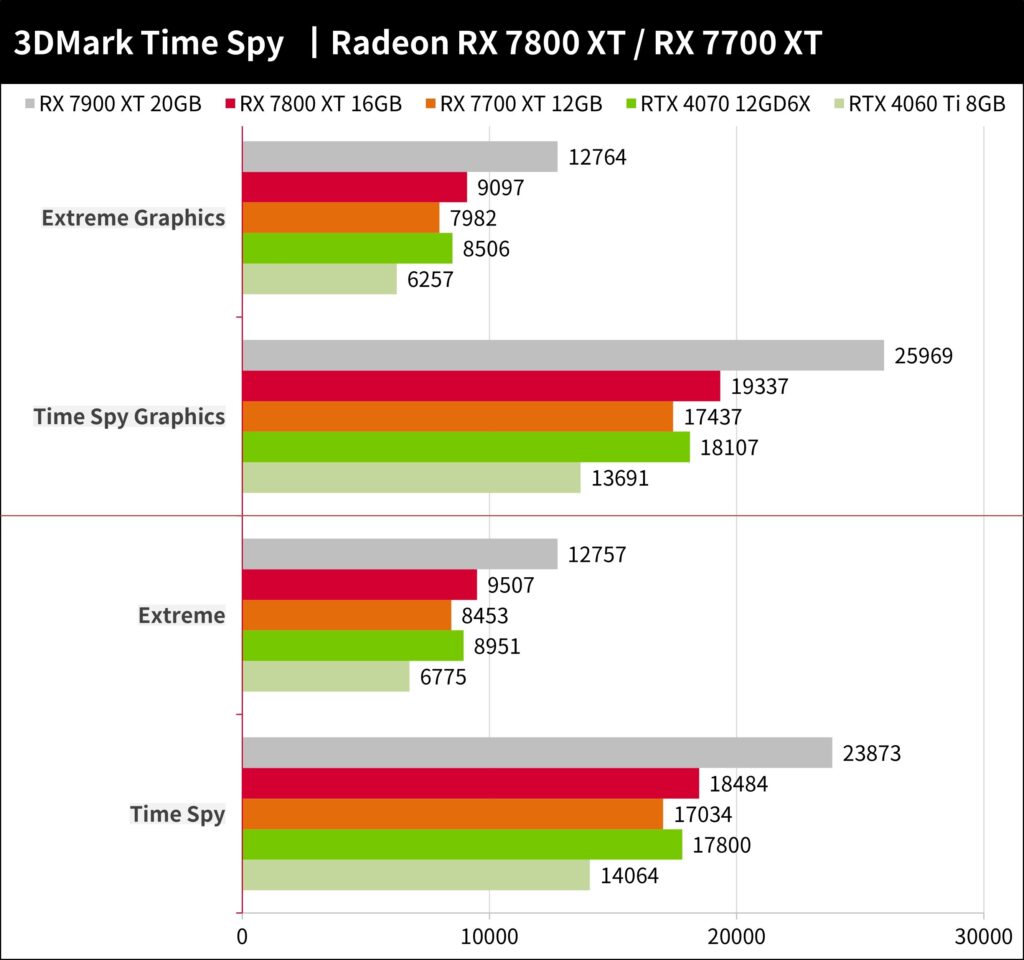
3DMark Time Spy utilizes the DirectX 12 API for its benchmarking, simulating the demands of modern AAA games. The test assesses performance at two resolution levels: 1440p and the more demanding Extreme 2160p. It provides distinct graphics scores to allow for a direct comparison.
In this benchmark, the RX 7800 XT posted scores of 19,337 points for Time Spy and 9,097 for Extreme. On the other hand, the RX 7700 XT registered scores of 17,437 in Time Spy and 7,982 in Extreme. When compared to their counterparts, the RX 7800 XT’s graphical performance surpasses the RTX 4070 by about 7%, while the RX 7700 XT has a significant 27% lead over the RTX 4060 Ti.
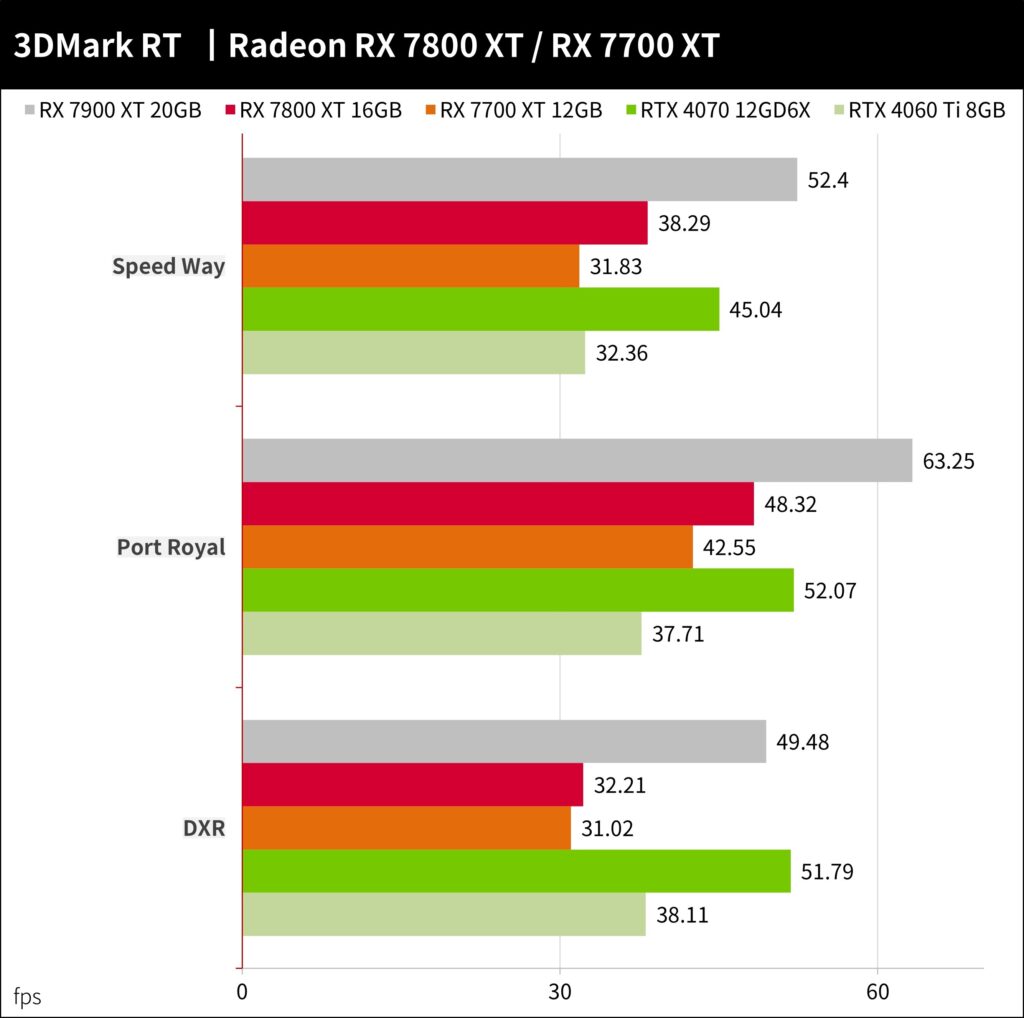
The 3DMark Port Royal benchmark integrates ray tracing into AAA game scenes to test the capability of the latest GPUs to accelerate hardware-based ray tracing. The DXR test specifically assesses the DirectX Raytracing API’s functionality. Meanwhile, the Speed Way scenario is completely built using ray tracing. Notably, this test does not utilize FSR or DLSS acceleration.
The RX 7800 XT delivered performances of 38.29 FPS in Speed Way, 48.32 FPS in Port Royal, and 32.21 FPS in DXR. On the other side, the RX 7700 XT posted scores of 31.83 FPS, 42.55 FPS, and 31.02 FPS for Speed Way, Port Royal, and DXR respectively. In terms of ray tracing capabilities, the RX 7800 XT lags behind the RTX 4070 by approximately 20%. In contrast, when pitted against the RTX 4060 Ti, the RX 7700 XT only trails by a marginal 2%.
AMD Radeon RX 7800 XT and RX 7700 XT – 4 E-Sports Games Performance Test
Four of the prominent e-sports titles – “Rainbow Six: Siege”, “League of Legends”, “APEX Legends”, and “CS:GO” – emphasize player skill, teamwork, and tactical gameplay. Being more strategy-focused than graphically demanding, they don’t require high-end graphics settings. As such, average frame rates (FPS) in these games typically exceed 100 FPS. The evaluation took place at both 1440p and 1080p resolutions using the games’ maximum graphics settings.
Both the RX 7800 XT and RX 7700 XT showcased ample performance for e-sports titles, consistently maintaining averages well above 200 FPS at 1440p and 1080p. When benchmarked against the RTX 4070, the latter stood out only in “APEX Legends”. In “League of Legends”, both GPUs performed comparably at 1440p, but NVIDIA’s GPU took the lead at the 1080p resolution.
AMD Radeon RX 7800 XT and RX 7700 XT – 10 game performance tests
Ten AAA games were benchmarked at both 1440p and 1080p resolutions with graphics enhancements activated. Of these, only “F1 2021” utilized ray tracing. The rest, lacking ray tracing and FSR acceleration, provided insights into the GPUs’ conventional rasterization capabilities.
The games tested were recent additions like “Baldur’s Gate 3” and “Diablo IV”, along with “F1® 22”, “Shadow of the Tomb Raider”, “Gears of War 5”, “Horizon: Zero Dawn”, “Borderlands 3”, “Red Dead Redemption 2”, “Assassin’s Creed: Valhalla”, and “God of War”.
At 1440p in AAA games, the RX 7800 XT averaged 128.58 FPS, while the RX 7700 XT managed 110.94 FPS. Compared to their Nvidia counterparts, the RX 7800 XT outperformed the RTX 4070 by roughly 4%, and the RX 7700 XT surpassed the RTX 4060 Ti by approximately 19%.
Switching to 1080p, the RX 7800 XT’s average climbed to 174.68 FPS, with the RX 7700 XT registering 153.85 FPS. In this resolution, the RX 7800 XT’s lead over the RTX 4070 was about 2%, whereas the RX 7700 XT was ahead of the RTX 4060 Ti by 16%.
Conclusively, while the RX 7800 XT and the RTX 4070 are closely matched with only a 2-4% difference, the RX 7700 XT enjoys a notable 17% edge over the RTX 4060 Ti. This disparity can largely be attributed to differences in VRAM and pricing. Though the RX 7700 XT’s performance is commendable, outmatching the RTX 4070 remains a tall order.
AMD Radeon RX 7800 XT and RX 7700 XT – 10 ray tracing game tests
Ten games with DXR light-tracing were evaluated, including titles from AMD’s annual “Starfield” collaboration, the recently released “Star Wars Jedi: Survivors”, “Hogwarts Legacy”, the acclaimed “The Witcher 3: Wild Hunt”, and others like “Cyber 2077”, “Control”, “Evil Castle Village”, “Spider-Man: Miles Moras”, “Marvel’s Star Trek”, and “Far Cry 6”.
Even though “Starfield” doesn’t have ray tracing, it utilizes FSR acceleration, which is why it’s featured on the list. Tests were conducted at 1440p and 1080p resolutions. Aside from maxing out effects/ray tracing settings, both FSR and DLSS3 acceleration were activated. Refer to the provided graph for specifics.
To break down the results at 1440p: “Starfield”, with FSR2 activated and a 75% render ratio, saw the RX 7800 XT averaging 76 FPS, while the RX 7700 XT managed 59 FPS. “Star Wars Jedi: Survivors” with FSR2 enabled resulted in the RX 7800 XT averaging 82 FPS and the RX 7700 XT at 70 FPS. For “Far Cry 6” at ultra-high FSR2 settings, the RX 7800 XT clocked an average of 126 FPS, with the RX 7700 XT coming in at 112 FPS.
In essence, for AMD-partnered games, the combined effect of ray tracing and FSR yields robust performance. Yet, it can’t currently match NVIDIA’s DLSS 3 acceleration. It remains to be seen how FSR 3’s acceleration will fare in upcoming tests.
For 1440p ray-tracing titles, the RX 7800 XT reached an average of 86.1 FPS, while the RX 7700 XT secured 75.2 FPS. In this category, the RX 7800 XT was outperformed by the RTX 4070 by roughly -29%, and the RX 7700 XT trailed the RTX 4060 Ti by about -19%.
Switching to 1080p, the RX 7800 XT scored an average of 105.4 FPS, with the RX 7700 XT not far behind at 93.7 FPS. Comparatively, the RX 7800 XT was bested by the RTX 4070 by approximately -31%, and the RX 7700 XT lagged behind the RTX 4060 Ti by nearly -20% in the ray tracing department.
AMD Radeon RX 7800 XT and RX 7700 XT power consumption and temperature measurements
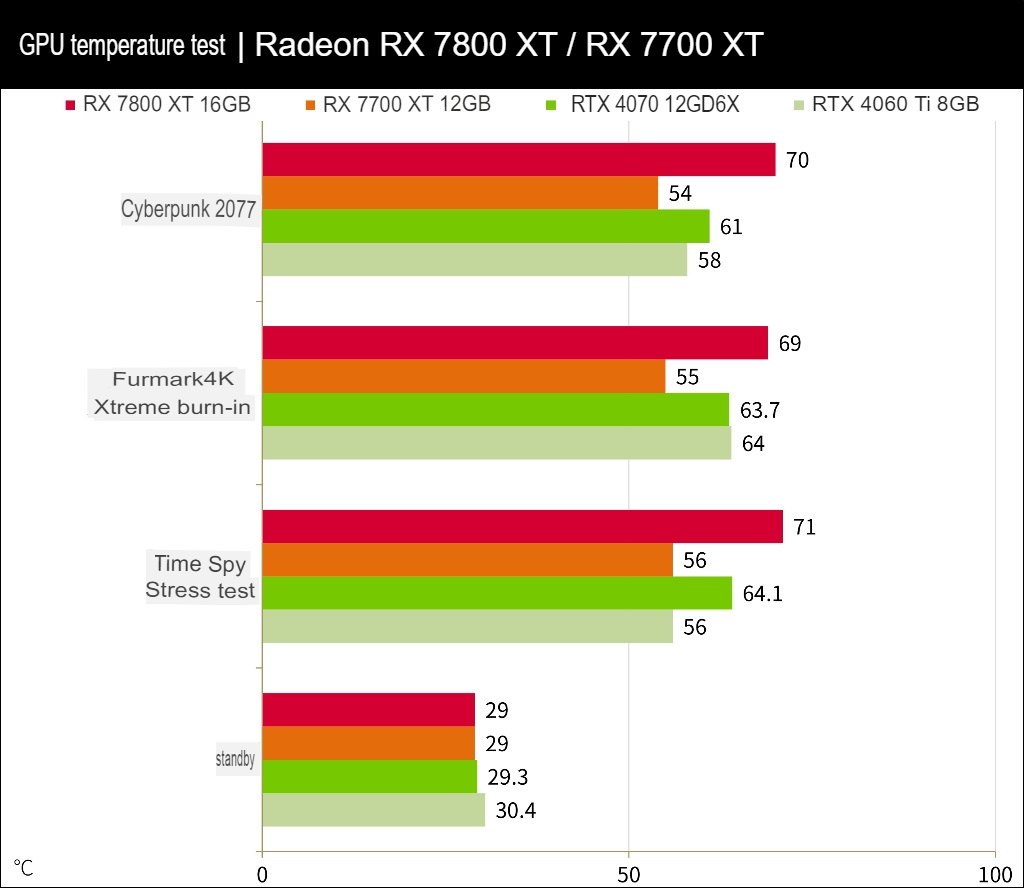
The energy use and heat output of the graphics card were evaluated using the Time Spy Stress test, Furmark, and “Dytronics 2077”. NVIDIA’s PACT tool was used to measure power consumption, which monitors energy from both the PCIe slot and the 12V power supply.
Regarding the temperature of the graphics cards, the standard RX 7800 XT peaked at 71°C during stress tests, whereas the custom-built RX 7700 XT recorded a notably cooler 56°C. This RDNA 3 generation, paired with the TSMC process, indeed demonstrates impressive thermal performance.
Summarize
The AMD Radeon RX 7800 XT and RX 7700 average a gaming performance of 75.2 FPS.
From the test results, the RX 7800 XT does seem to have an edge over the RTX 4070, and the RX 7700 XT outperforms the RTX 4060 Ti in high-end games. But when it comes to ray-tracing titles, without the introduction of FSR 3, AMD can only enhance performance through partnership games. For graphically demanding ray-traced games on the RX 7800 XT and RX 7700 XT, it’s advisable to play at 1080p or dial down the graphical settings.
Conversely, the memory setup of the RX 7800 proves beneficial in tasks requiring larger VRAM, like multimedia processing and AI generation. AMD’s offerings generally come with more generous memory configurations compared to competitors.
In Taiwan, the AMD Radeon RX 7800 XT and RX 7700 XT are expected to be priced at NT$ 17,590 and NT$ 15,790, respectively. When examining the price-to-performance ratio for high-end games, the hierarchy is RX 7800 XT > RX 7700 XT > RTX 4060 Ti > RTX 4070. Conversely, for ray-tracing titles, the ranking flips to RTX 4060 Ti > RTX 4070 > RX 7800 XT > RX 7700 XT.
Essentially, the performance gap between the RX 7800 XT and RX 7700 XT, especially concerning DLSS acceleration, is significant. All eyes are now on AMD’s anticipated release of their “FSR 3” acceleration tech, which will leverage AMD Fluid Motion Frames to enhance both ray-tracing and general game performance. Gamers should keep an eye out for further updates.

If this article is helpful for you, please share this article with your friends on social media. Thank you!
This article is based on the personality of the reviews. You are responsible for fact-checking if the contents are not facts or accurate.
Title: RDNA 3’s grand gathering! AMD Radeon RX 7800 XT and RX 7700 XT review/ The 2K sharpshooter arrives