In the fateful confrontation, Intel once again shouted to AMD: “You shall not pass!” The 13th generation Intel Core processor maintains the hybrid core architecture, and doubles the number of E-Core cores in the whole series and increases the P-Core clock to the highest 5.8GHz, equipped with a larger L2 cache, let the i9-13900K once again dominate the double crown of multi-core and game performance. In this test, the i9-13900K, i7-13700K and i5-13600K competed against the Ryzen 7000 series, allowing gamers Learn the love-hate relationship between next-generation processors at once.
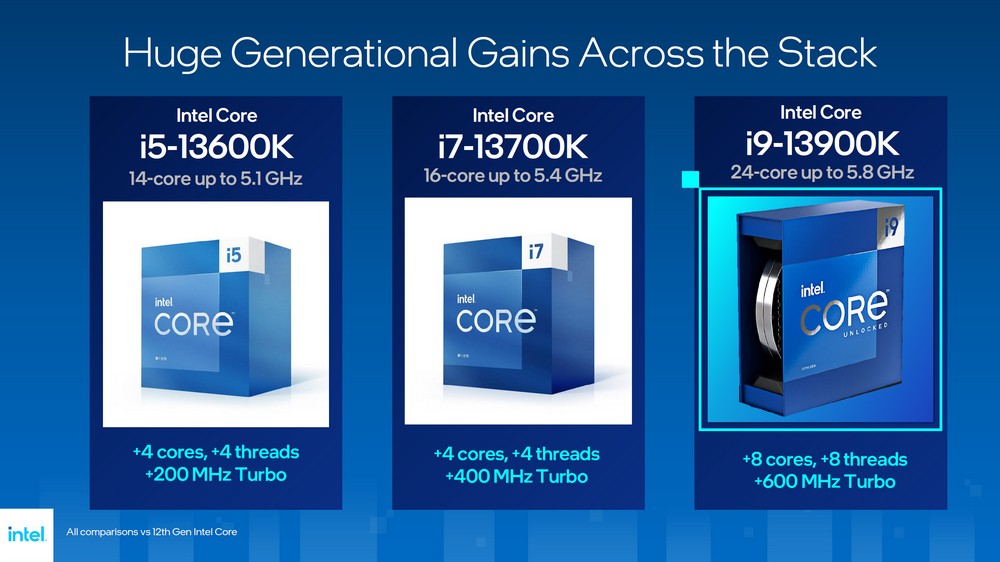
The first three 13th generation Intel Core K series overclocked processors: i9-13900K, i7-13700K, i5-13600K
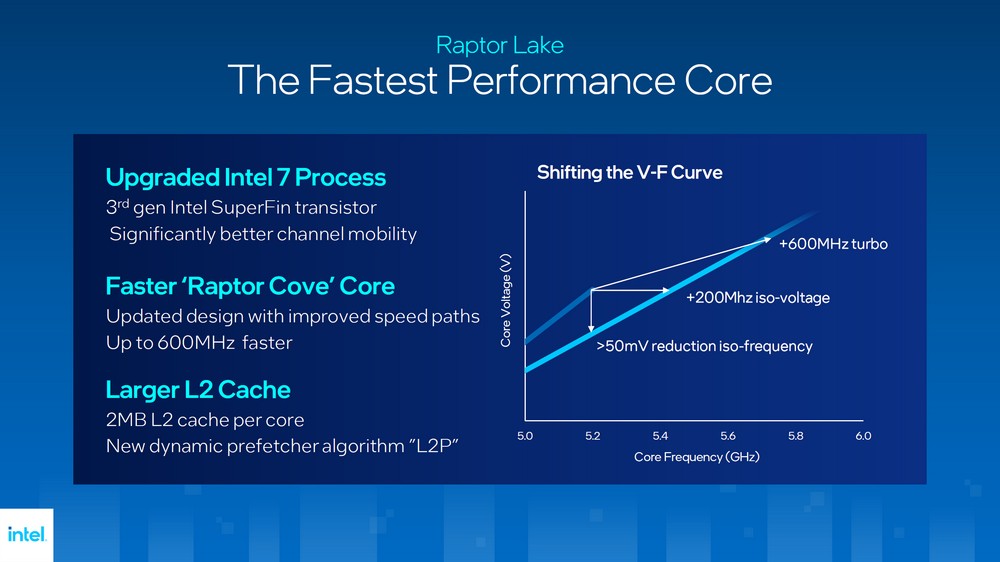
The 13th generation Intel Core processor code name “Raptor Lake”, mainly uses the upgraded Intel 7 process, 3rd gen Intel SuperFin The transistor and the higher clock Raptor Cove core architecture can bring a higher Turbo clock, plus the large capacity of 2MB L2 cache per core so that the 13th generation Intel Core processor can have better performance multi-core and gaming performance.
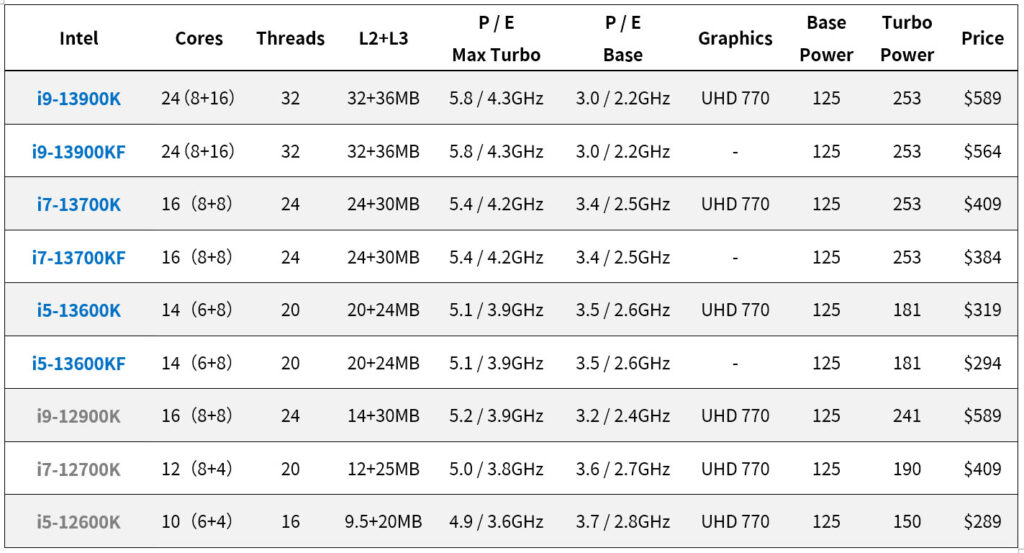
The first wave of three 13th-generation Intel Core K series overclocked processors, the flagship i9-13900K has 24 (8+16) cores and 32 threads, and the high-end i7-13700K has 16 (8+8) cores and 24 threads. Compared with the mainstream i5-13600K’s 14 (6+8) core 20 threads, in other words, the entire series of E-Cores are 2x more than the previous generation. In other words, this generation i7-13700K can surpass the previous generation i9-12900K. efficiency.
In addition to 8P+6E and 32 threads, the i9-13900K has a total of 32+36MB of large L2+L3 cache capacity, and the highest P-Core Turbo 5.8GHz, E-Core 4.3GHz high clock, but it also makes The highest power consumption comes to 253W, and the US dollar price is the same as $589.
As for the i7-13700K, it is 8P+8E, 24 threads, 24+30MB cache, up to P-Core Turbo 5.4GHz, E-Core 4.2GHz, and up to 253W Turbo power consumption. The US dollar price is the same as $409.
However, the i5-13600K has 6P+8E, 20 threads, 20+24MB cache, up to P-Core Turbo 5.1GHz, E-Core 3.9GHz, and up to 181W Turbo power consumption. The US dollar price has increased by $319.
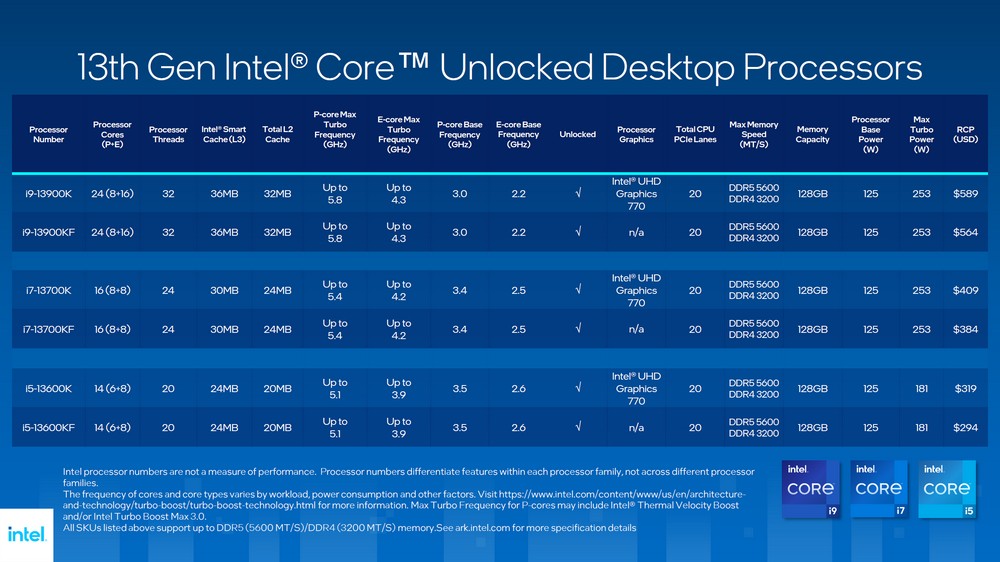
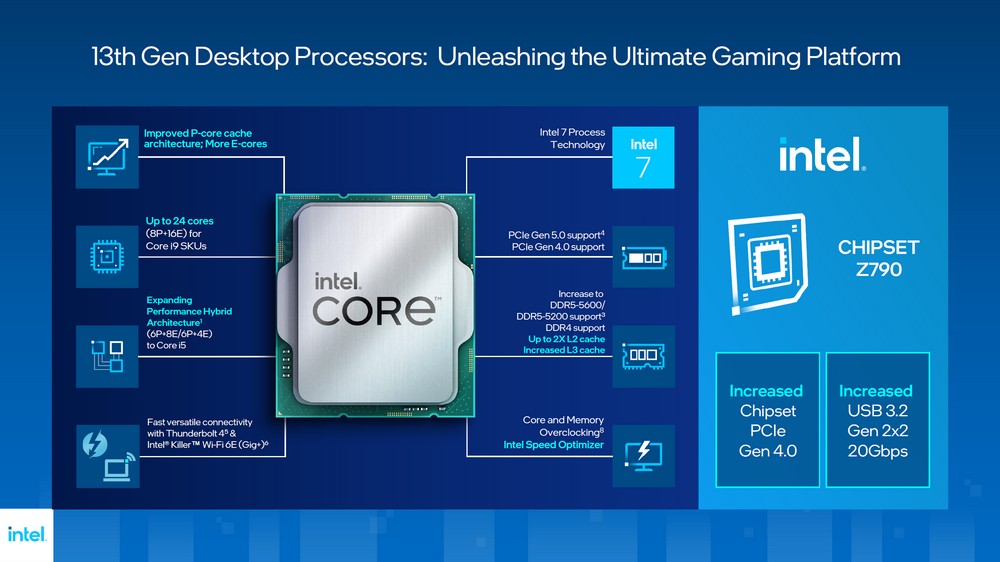
The upgrade of the 13th generation Intel Core processor focuses on clock enhancement, doubling E-Core, and increasing L2 cache, so the number of PCIe provided by the processor is still PCIe 5.0 x16 and PCIe 4.0 x4, while the memory clock is increased Up to DDR5-5600, DDR4 memory is also supported.
With the relative processor I/O specifications unchanged, it is difficult for the Z790 chipset to change too much. Each board factory mainly upgrades the Z790 with minor changes. Therefore, players who want to save money can choose the previous generation Z690. Or a B660 motherboard with a 13th-generation processor.
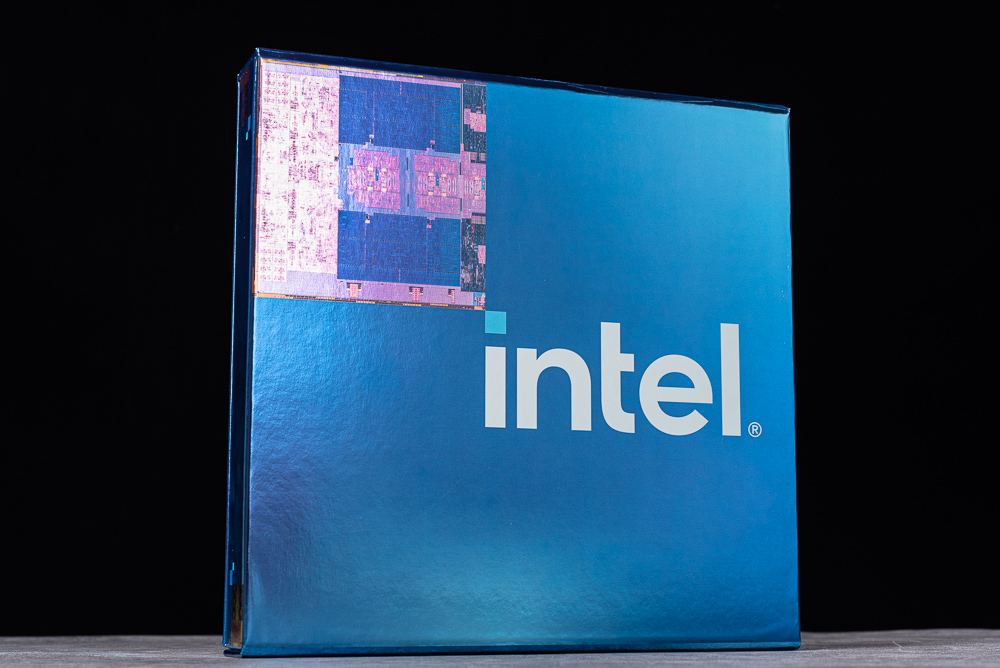
The new Intel Core i9-13900K also has a beautiful silver wafer box, but the overall package size is reduced to facilitate transportation, and the packaging of the i7-13700K and i5-13600K is still the same.
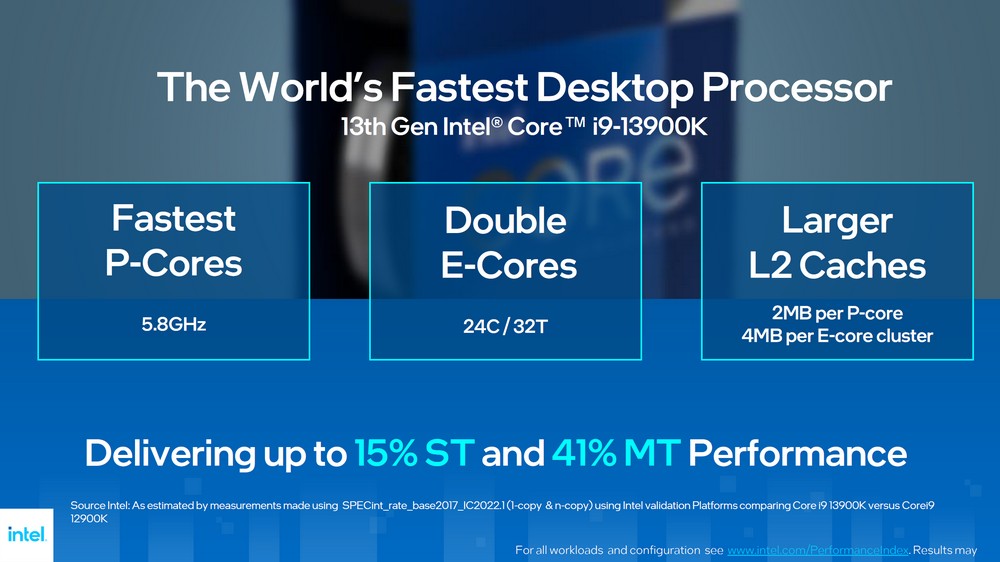
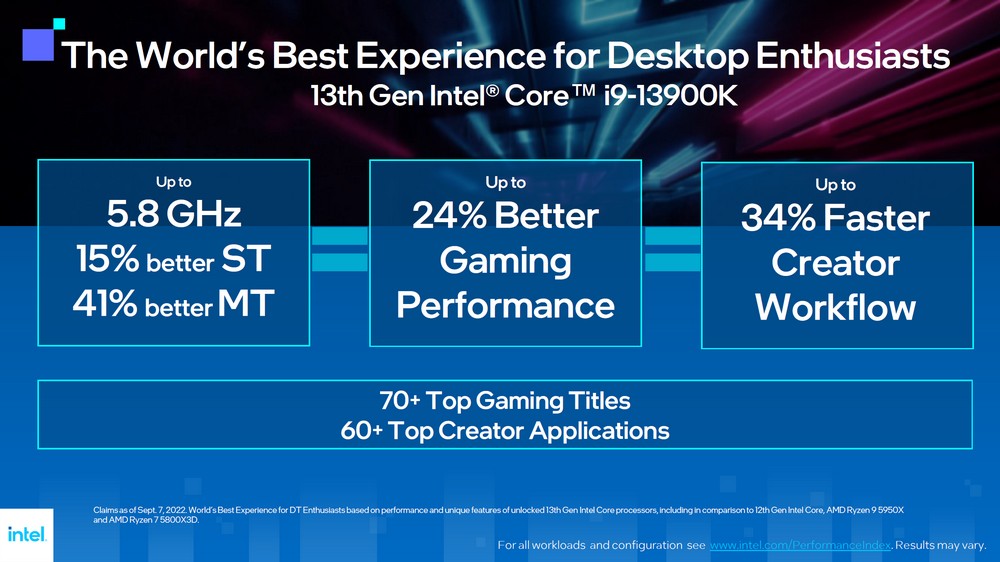
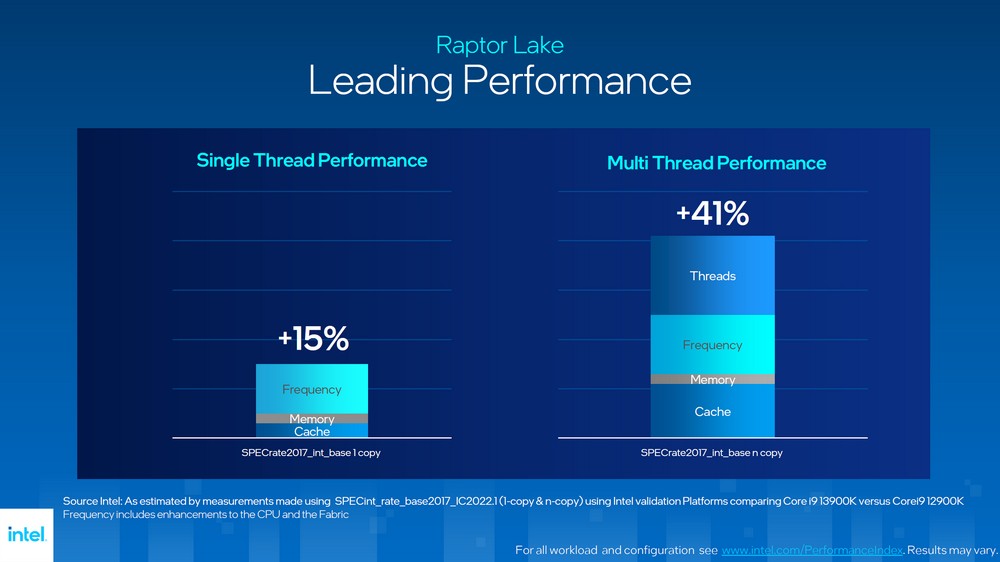
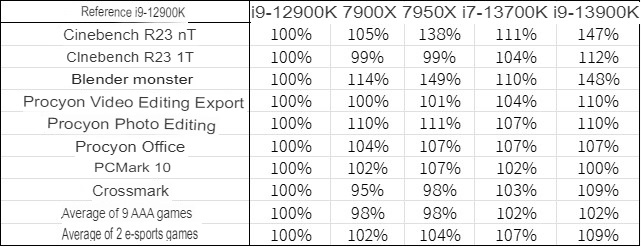
Intel’s conclusion is that the i9-13900K has a maximum of 5.8GHz, a single-core 15% and a multi-core 41% increase, and the game has a 24% performance lead and a 34% creative performance advantage.
Upgraded Intel 7 process, 3rd gen Intel SuperFin, Raptor Cove +600MHz
Intel’s hybrid core architecture strategy, using the performance core P-Core mixed efficiency core E-Core, with high clock P-Core responsible for high-performance front-end work, and E-Core can greatly improve the computing performance of parallel computing and multi-threading in addition to the back-end help, and through the hardware unit of Thread Director, the operating system can monitor the instruction distribution of each thread in real-time, Mix conditions and schedule work automatically and intelligently.
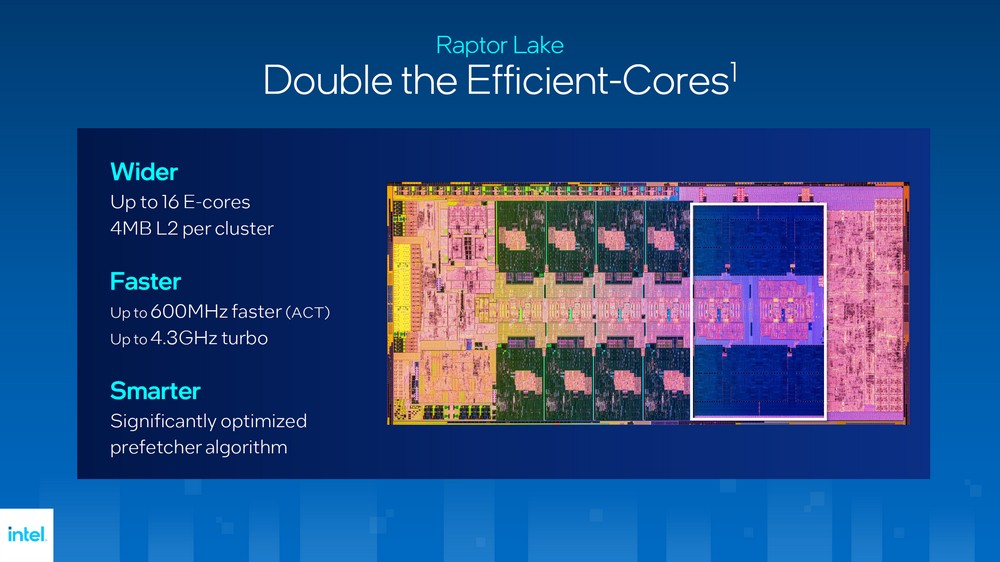
13th generation Intel Core processor Raptor Lake, using an upgraded Intel 7 process, 3rd gen Intel SuperFin transistors, and higher clock Raptor Cove (P-Core) core architecture, and each core has 2MB L2 cache high capacity, and adopts the new dynamic prefetching algorithm “L2P”.
That is to say, for the 13th generation Intel Core processor, each P-Core has 2MB L2 cache, and every 4 E-Cores share 4MB L2 cache, so the L2 cache of i9-13900K is increased to 32MB, while the original 36MB The capacity of the L3 shared cache remains unchanged.
A major focus of this generation of upgrades is to double the performance of the core E-Core, up to 16 E-Core, 4MB L2 cache, and greatly increase the E-Core clock of this generation to a maximum of 4.3GHz, and optimize the core prefetch algorithm.
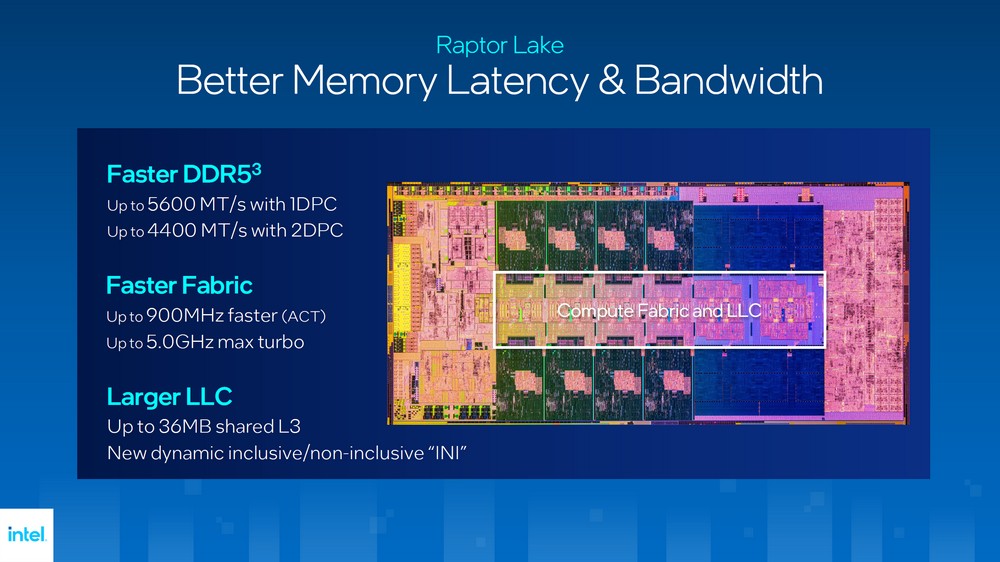
Raptor Lake shares a 36MB L3 cache, which allows the processor to have lower memory latency and bandwidth. DDR5 supports 1DPC 5600MT/s and 2DPC 4400MT/s. And has a faster Fabric clock and Turbo performance.
Raptor Lake’s performance is leading. In the single-core 15% improvement, the performance improvement is mainly due to the stacking of clock, memory, and cache upgrades, while the multi-core 41% performance improvement requires more. E-Core stacking performance.
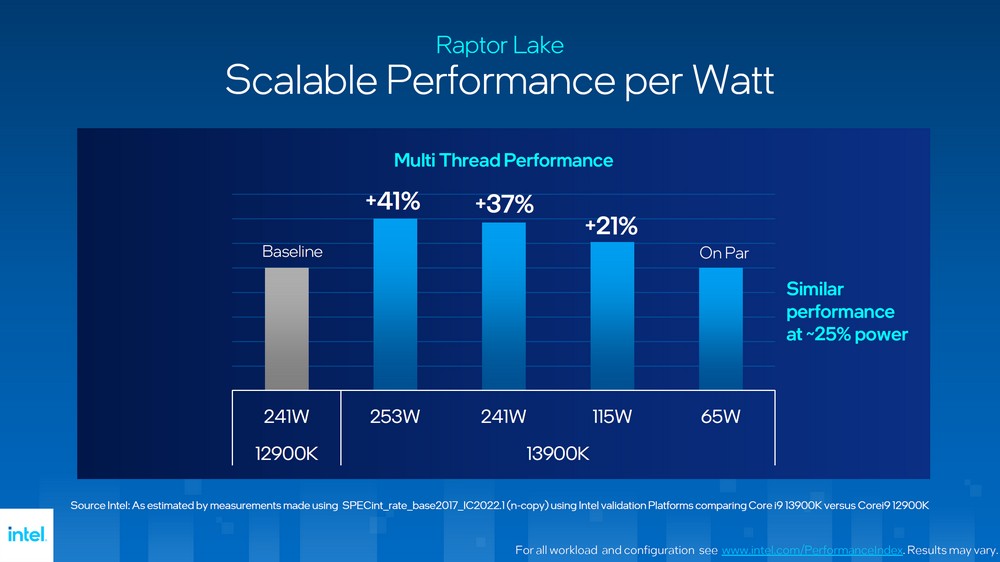
In addition, the i9-13900K can achieve the performance of the i9-12900K 241W at a power consumption of 65W, and it can increase the multi-thread performance by 41% under the condition of up to 253W in this generation.
In the optimization of Raptor Lake and the system, the Thread Class Boundaries through machine learning are mainly updated for Intel Thread Director, and the background programs vs. user-initiated background programs are optimized in the Windows 11 22H2 update. Dynamic Tuning Technology will be updated when the 13th-generation mobile processors are available.

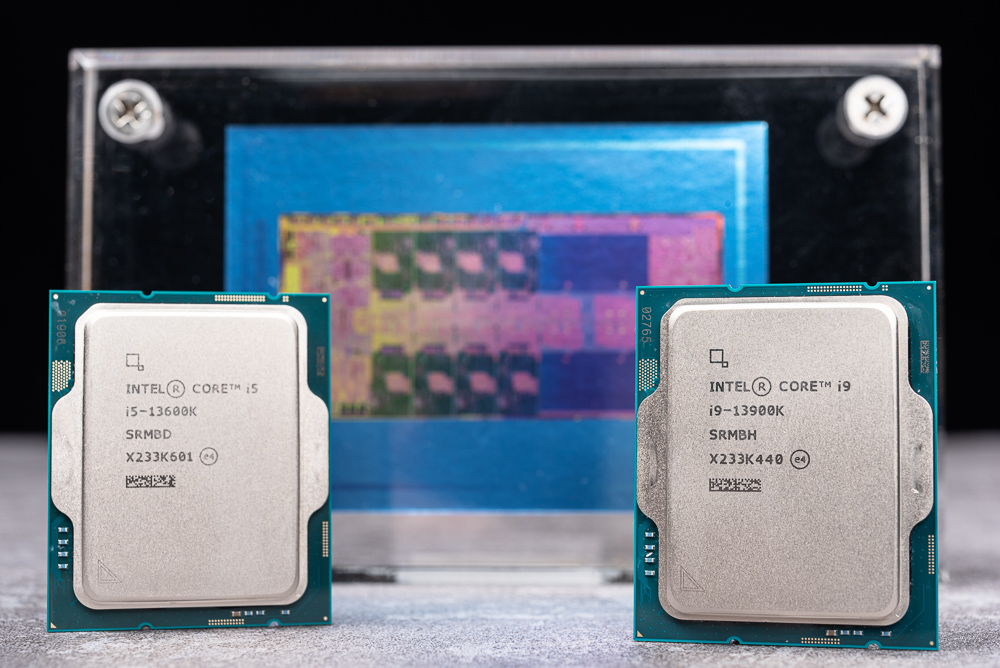
The media version of Intel Core i9-13900K and i5-13600K out of the box
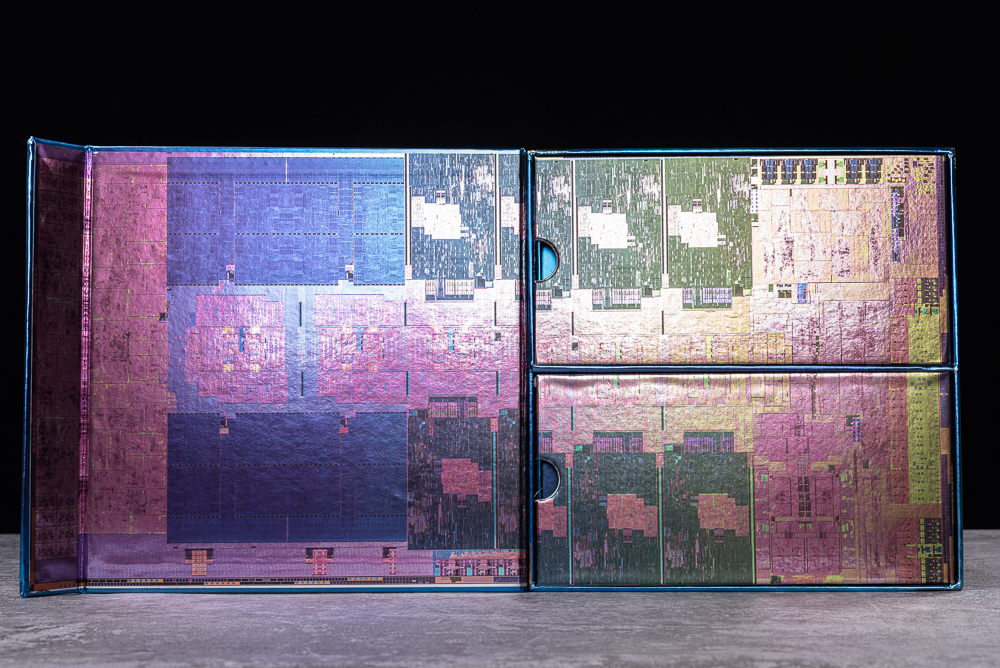
Intel provides the same 13th generation flagship i9-13900K and mainstream i5-13600K processors, the media version has a gift box-like packaging, and inside is a beautifully printed Die of Raptor Lake Shot image, visible P-Core, E-Core, graphics core, memory peripheral and other blocks.
Inside the gift box are the official versions of the Intel Core i9-13900K, i5-13600K, and a commemorative Raptor Lake Die Shot acrylic version.
Test platform and settings
The 13th generation Intel Core processor doubles the E-Core, increases the L2 cache, and greatly increases the Turbo clock. The i9-13900K’s maximum Turbo 5.8GHz technology is higher than the Ryzen 9 7950X’s 5.7GHz Boost. Therefore, in this test, in addition to the i9-13900K, i7-13700K and i5-13600K, the comparison of Ryzen 7950X, 7900X, 7700X and 7600X, and the previous generation i9-12900K, i7-12700K and i5-12600K were also added to give players a comprehensive performance comparison. in accordance with.
In the test, use the motherboard default Auto and apply the DDR5-6000 EXPO memory settings; the test platform is provided below for your reference.
Test Platform
Processor: Intel Core i9-13900K, i7-13700K, i5-13600K
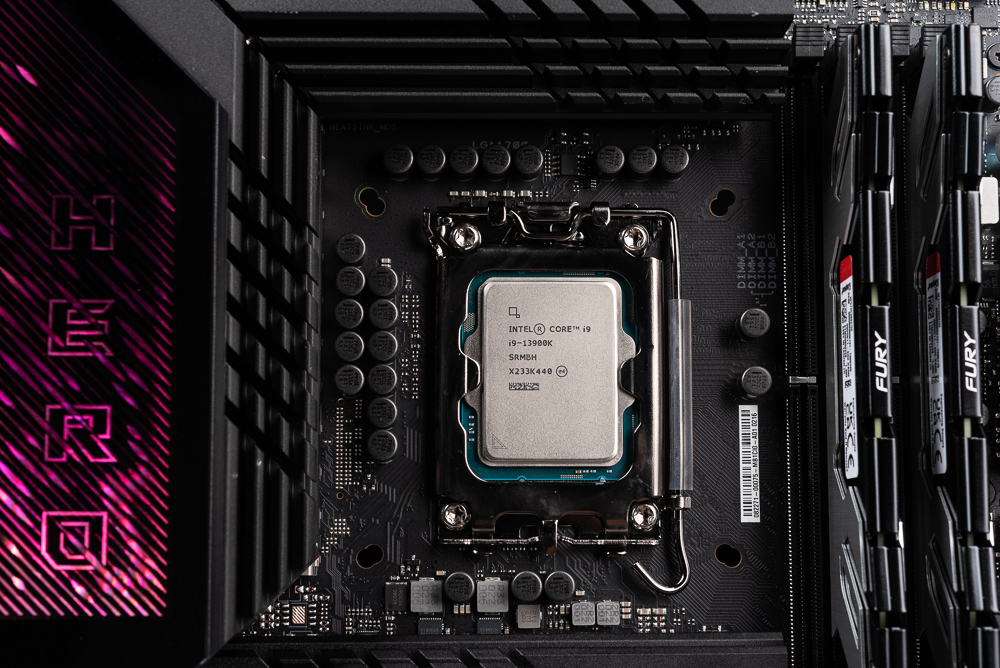
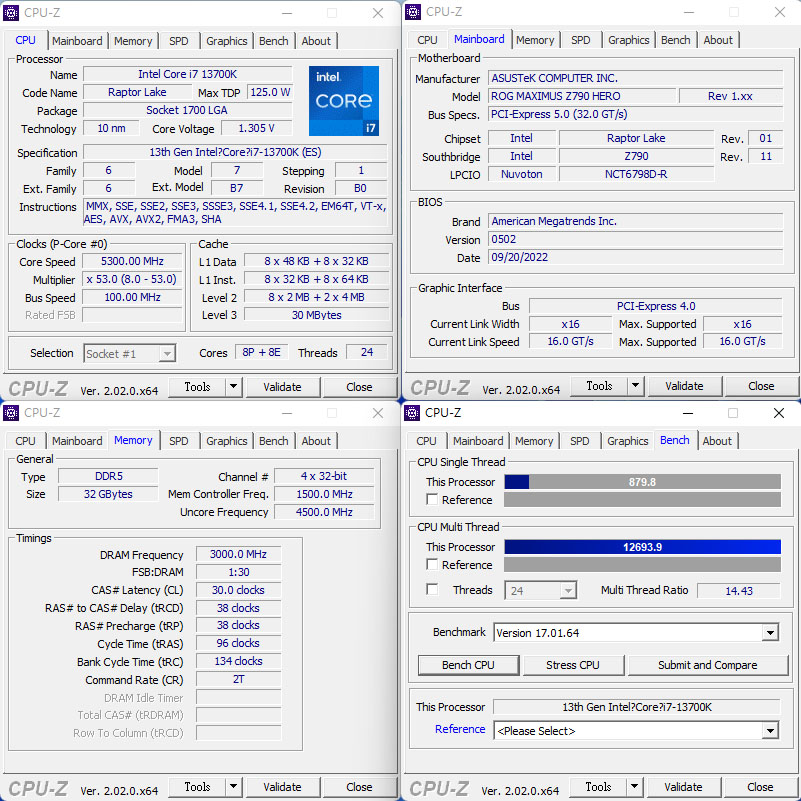
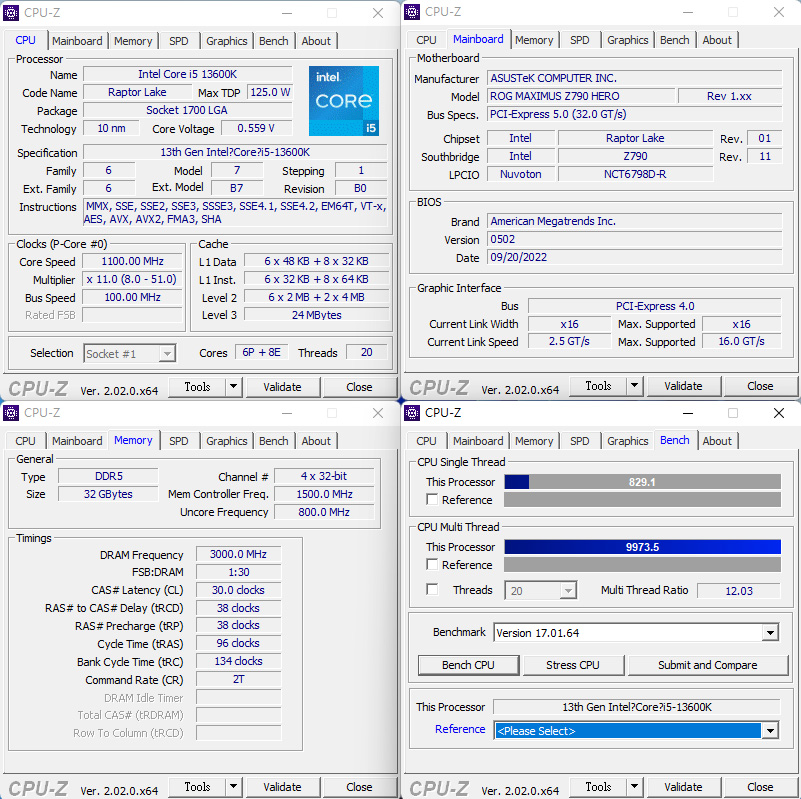
Motherboard: ASUS ROG ROG MAXIMUS Z790 HERO 0502
Memory: G.SKILL TRIDENT Z5 NEO DDR5-6000 16GBx2
Graphics Card: NVIDIA GeForce RTX 3080 Ti
System Disk: Solidigm P41 Plus 1TB PCIe 4.0 SSD
Cooler: ASUS ROG STRIX LC II 280mm
Power Supply: Seasonic PRIME PX-1000
Operating System: Windows 11 Pro 21H2
Processor: AMD Ryzen 9 7950X, 7600X
Motherboard: ASUS ROG CROSSHAIR X670E HERO 0604
Memory: G.SKILL TRIDENT Z5 NEO DDR5-6000 16GBx2
Processor: Intel Core i9-12900K, i7-12700K, i5-12600K
Motherboard: ASUS ROG MAXIMUS Z690 HERO 2004 / ASRock Z690 Tiachi 11.01
Memory: G.SKILL TRIDENT Z5 NEO DDR5-6000 16GBx2
Processor computing performance Cinebench, VRay rendering test
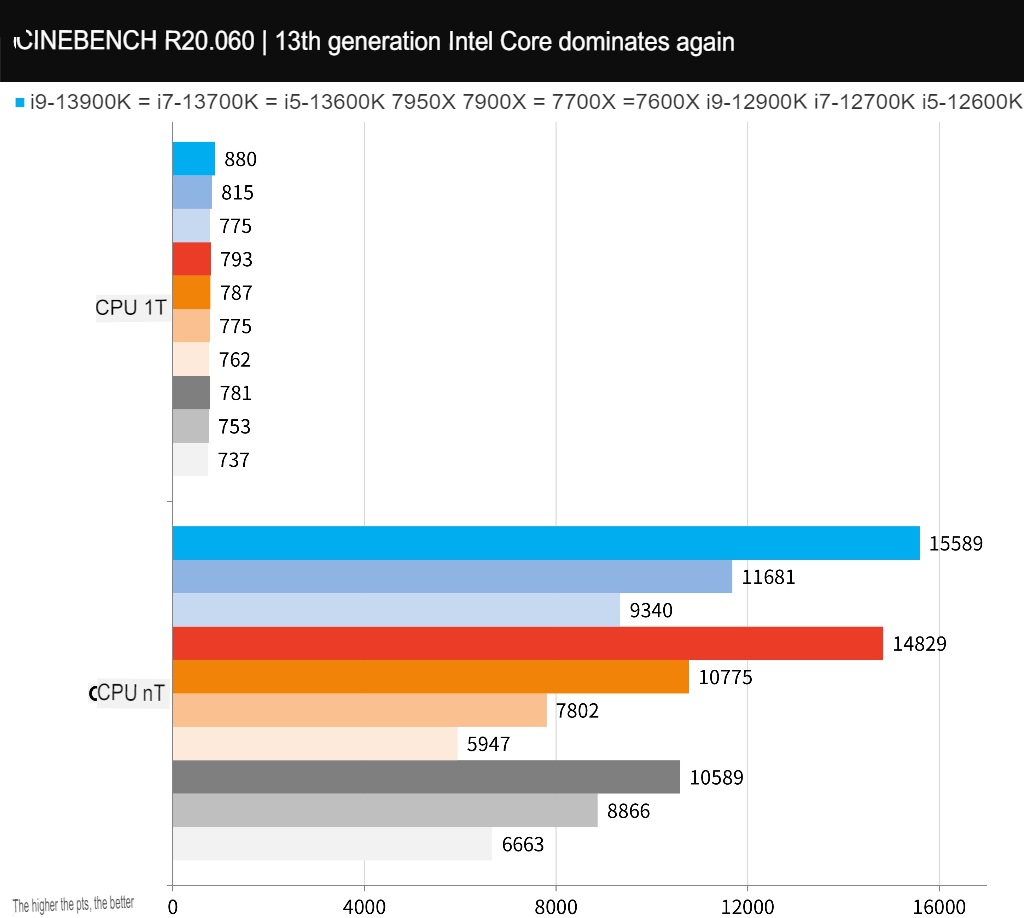
CINEBENCH R20, developed by MAXON based on Cinema 4D, can be used to evaluate the 3D rendering performance of computer processors, which is also a reliable test software that can quickly evaluate the performance of CPU multi-core computing.
The i9-13900K multi-threaded nT 15589 leads the pack, the i7-13700K nT 11681 points, and the i5-13600K nT 9340 points. The single thread 1T score is, i9-13900K 1T 880 points, i7-13700K 1T 815 points, i5-13600K 1T 775 points.
In contrast, the i9-13900K has 5% more nT performance than the 7950X, and 47% more nT performance than the previous generation i9-12900K; and the i7-13700K has 8% more nT than the 7900X and 8% more than the i9- 10% more than 12900K; i5-13600K outperforms 7700X nT 20% and 7600X nT 57% respectively in multi-core performance.
As for the 1T performance improvement, the i9-13900K is 11% higher than the 7950X and 13% higher than the previous generation i9-12900K; while the i7-13700K’s 1T is 4% higher than the 7900X and i9-12900K; and the i5-13600K The 1T performance is comparable to the 7700X and 7600X.
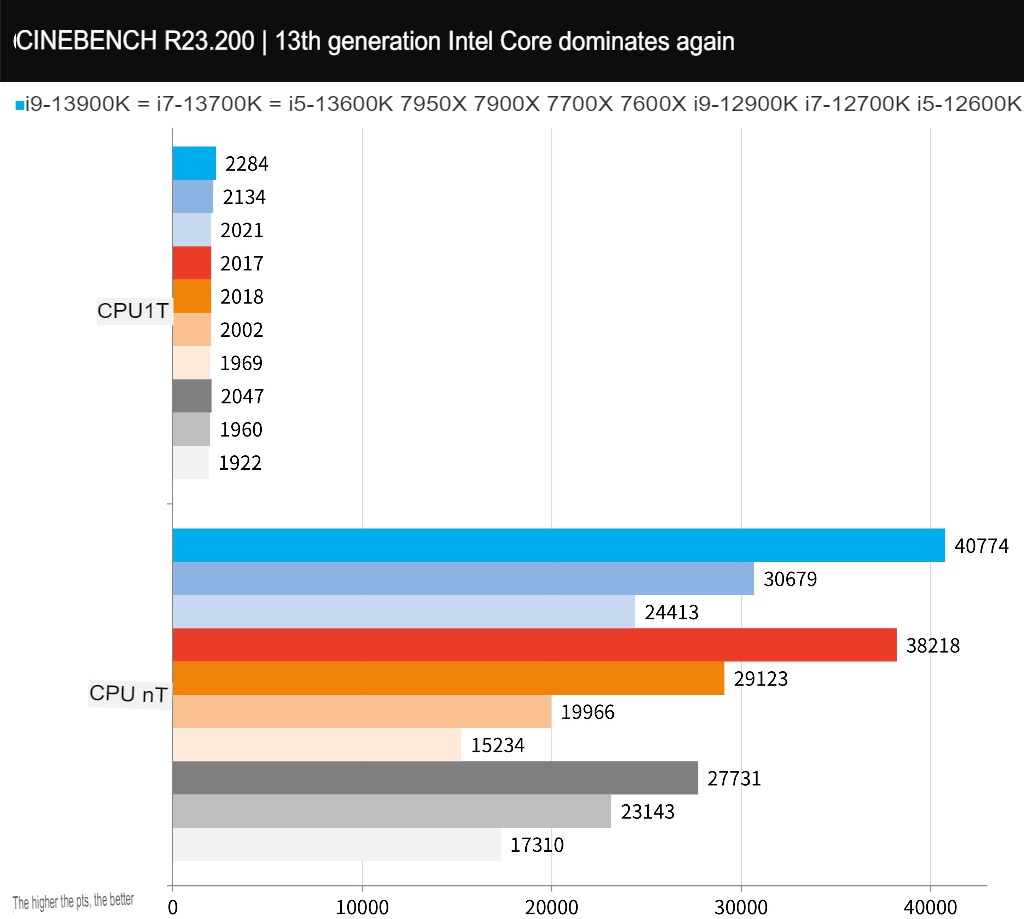
CINEBENCH R23 has the same test situation as R20. It uses a new compiler and has a stress test function. Players can customize the Minimum Test Duration time, such as 10 or 30 minutes to test the stability of the computer; however, the results of R23 cannot be compared with R20.
The i9-13900K multi-threaded nT achieved a score of 40774 points, the i7-13700K nT 30679 points, and the i5-13600K nT 24413 points. The single thread 1T scores are, i9-13900K 1T 2284 points, i7-13700K 1T 2134 points, and i5-13600K 1T 2021 points.
In contrast, the i9-13900K is 7% more efficient in nT than the 7950X, and 47% more efficient than the previous generation i9-12900K; 11% more than 12900K; i5-13600K beats 7700X nT 22% and 7600X nT 60% in multi-core performance respectively.
As for the 1T performance improvement, the i9-13900K is 13% higher than the 7950X and 12% higher than the previous generation i9-12900K; while the i7-13700K’s 1T is 6% higher than the 7900X, and the i9-12900K is 4% higher. %; while the 1T performance of the i5-13600K is comparable to the 7700X and 7600X.
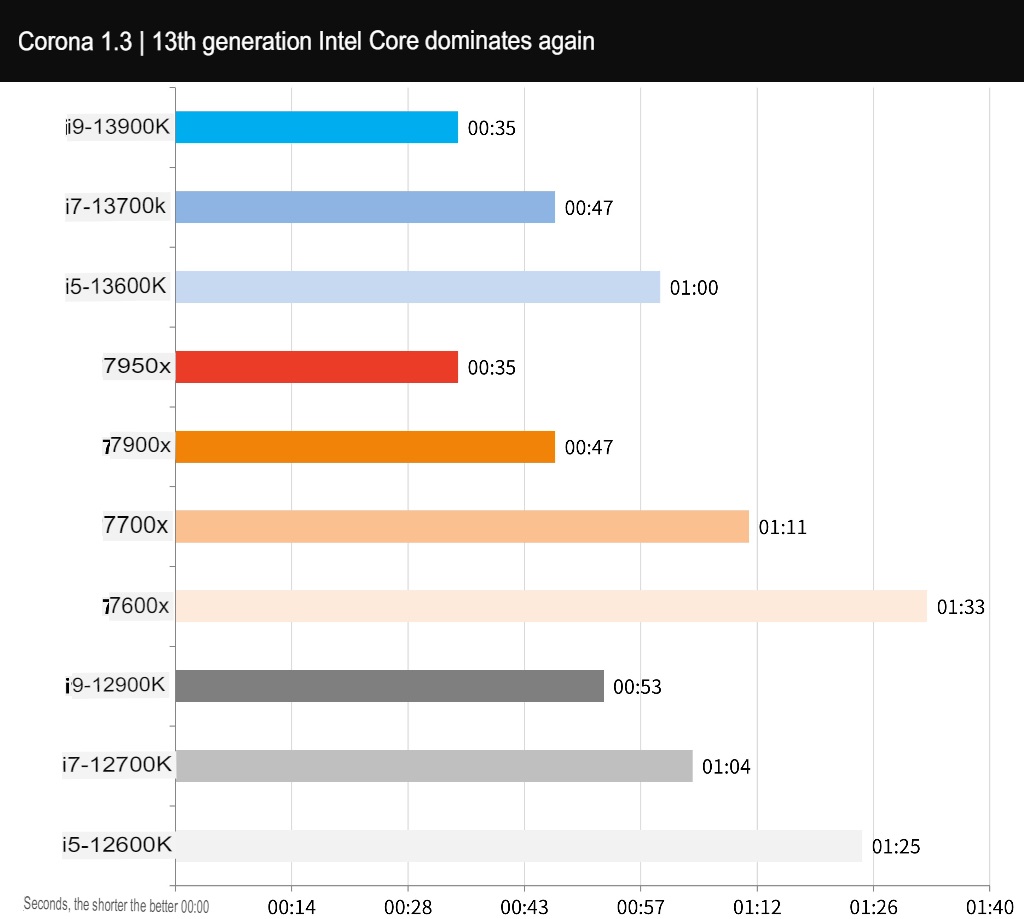
Corona Benchmark is a relatively easy-to-operate test tool, using Corona Renderer 1.3 renderer for testing, comparing the rendering speed of the processor and the performance of Rays/s, and the score is the timing in seconds.
The i9-13900K takes just 35 seconds, the i7-13700K 47 seconds, and the i5-13600K 1 minute. It’s just that the i9-13900K is tied with the 7950X in this test, the i7-13700K is tied with the 7900X, and the i5-13600K is faster than the 7700X and 7600X.
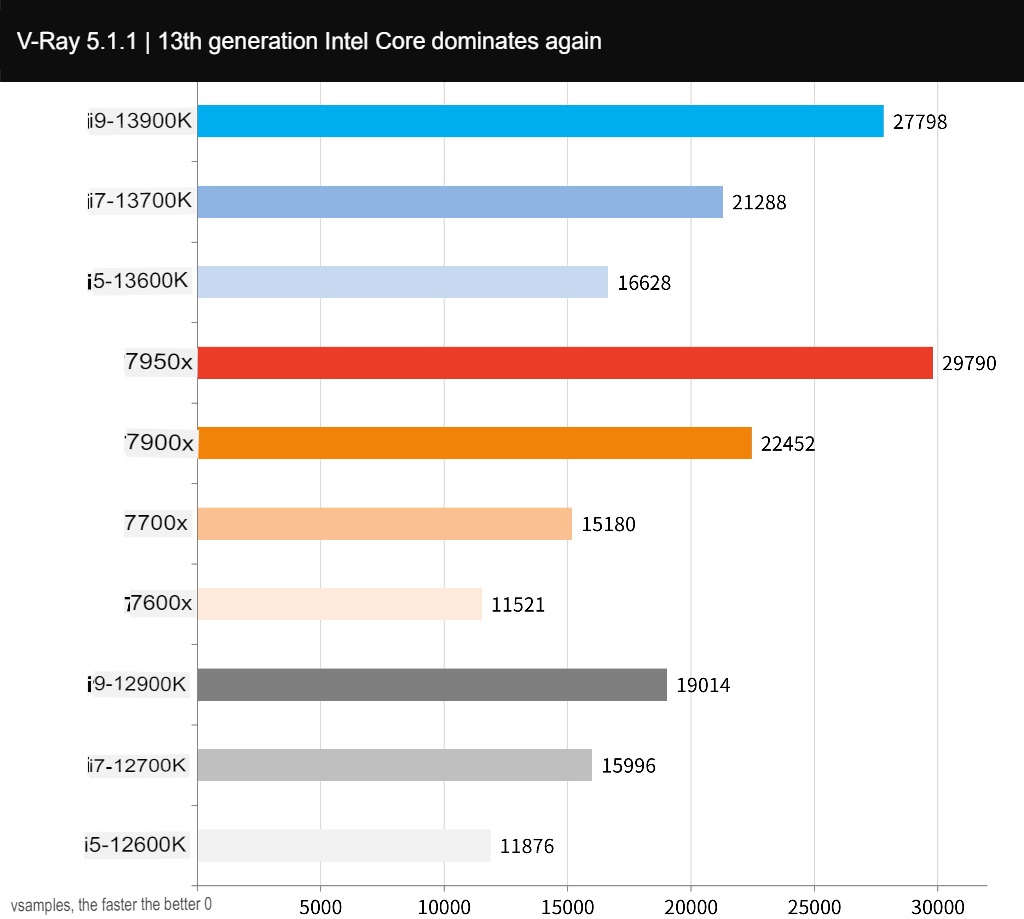
V-Ray Benchmark is developed by Chaos Group. V-Ray is a ray rendering software designed based on the laws of physics. This tool can be used for CPU performance testing of ray tracing rendered images. The CPU score is calculated in vsamples per second. number as a unit.
i9-13900K reaches 27798 vsamples, i7-13700K 21288 vsamples, i5-13600K 16628 vsamples. But in this project i9-13900K loses 7950X -7%, i7-13700K loses 7900X -5%, and i5-13600K is still stronger than 7700X and 7600X.
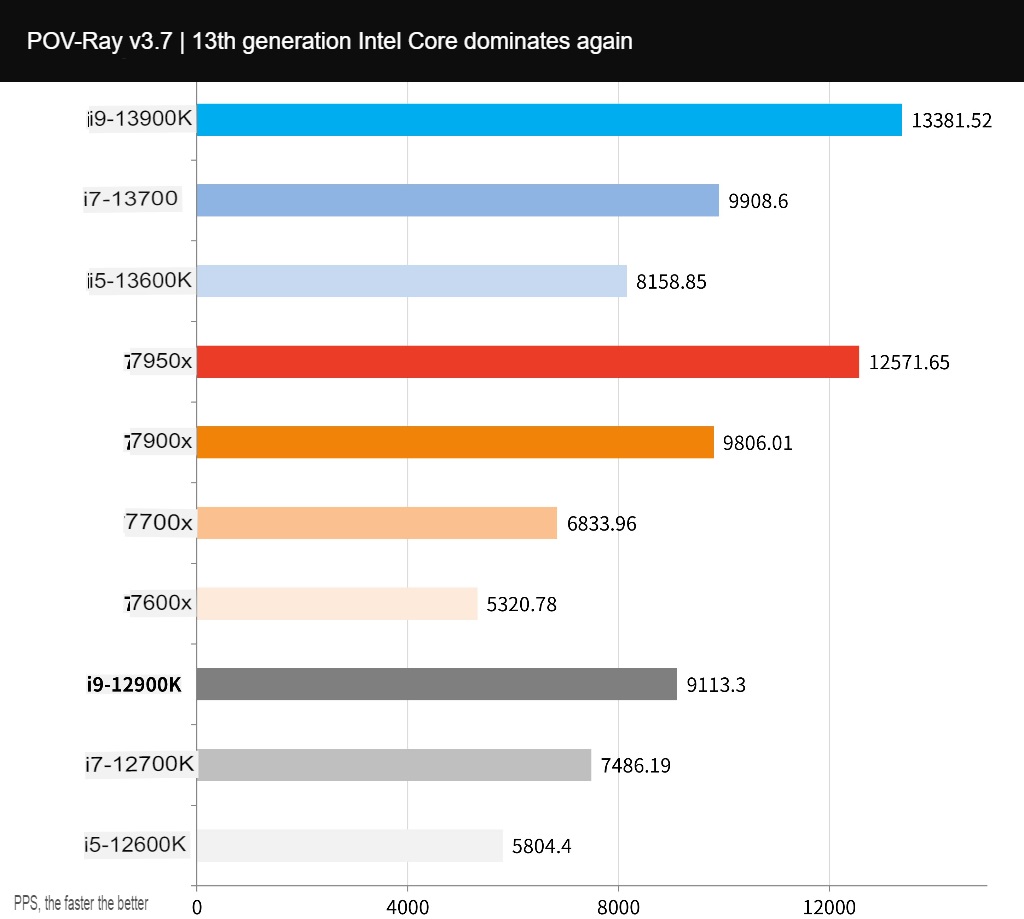
POV-Ray is another set of free ray tracing 3D rendering tools. It uses the computing power of a multi-core CPU to calculate the rendering of light and shadow and 3D images.
i9-13900K achieves 13381.52 PPS, i7-13700K 9808.6 PPS, i5-13600K 8158.85 PPS. The i9-13900K is 6% more efficient than the 7950X, the i7-13700K is close to the same as the 7900X, and the i5-13600K is still 19% more than the 7700X and 53% more than the 7600X.
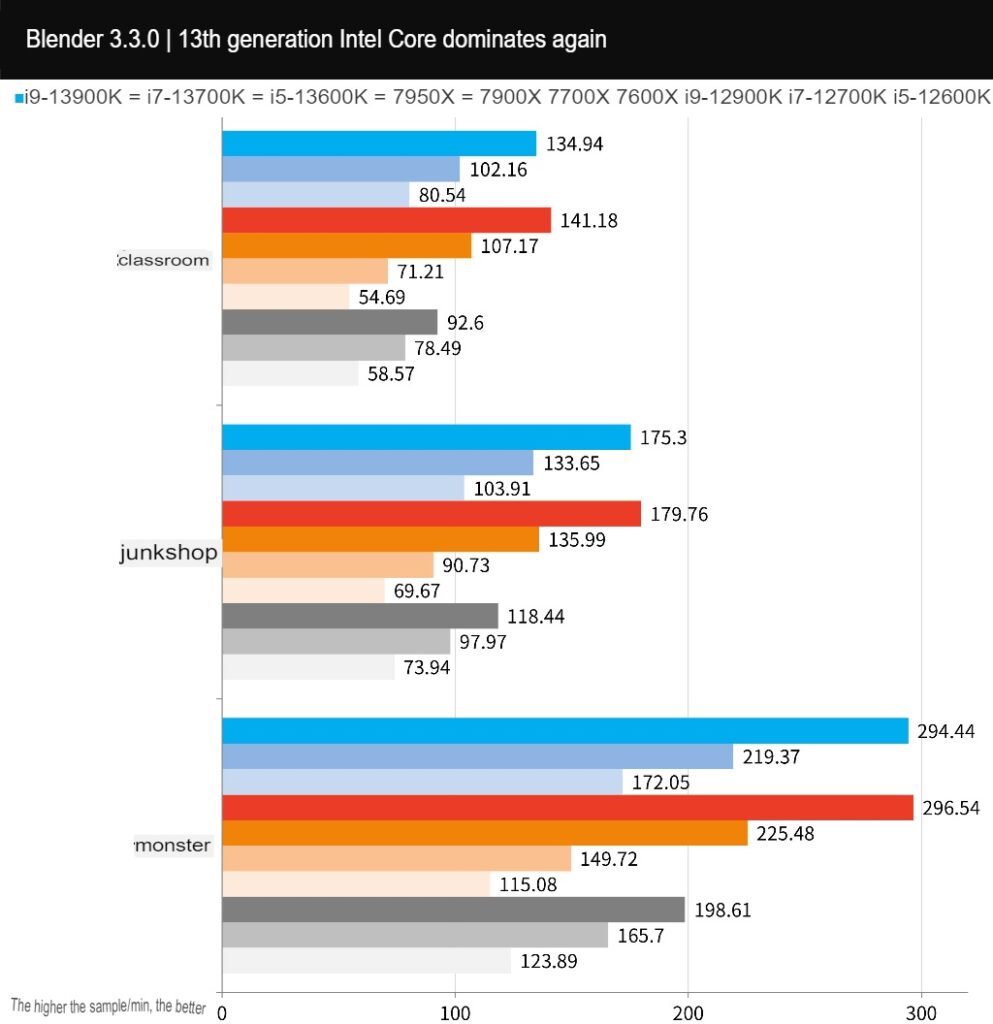
Blender is a cross-platform, open-source 3D authoring tool that supports CPU and GPU rendering acceleration, as well as various 3D operations: Modeling, Rigging, Animation, Simulation, Rendering, Compositing, and Motion Tracking. Tested using Blender Benchmark 3.3.0.
The test result of this project is that the performance of the 7950X leads the i9-13900K by 1%, and the 7900X also slightly wins the i7-13700K, but the i5-13600K still beats the 7700X and 7600X.
Summary: From the perspective of CPU multi-core rendering performance, Intel Core i9-13900K is undoubtedly the multi-core performance champion, but the strength of 7950X and 7900X should not be underestimated. The i7-13700K can directly overtake the previous generation i9-12900K, and the i5-13600K continues to bully the 7700X and 7600X.
Creation of PR image output, LR and PS photo editing performance test
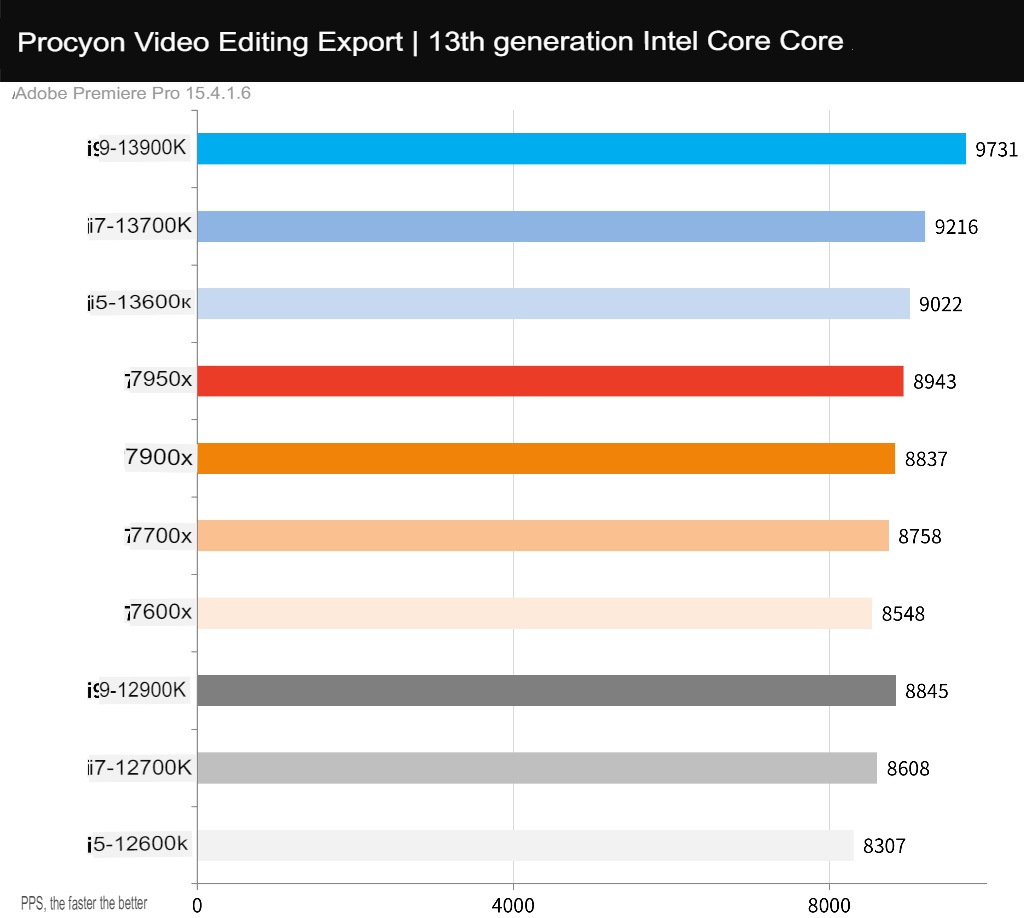
The conversion output test for Adobe Premiere Pro 2022, using the UL Procyon Video Editing Benchmark test tool, the test scenario is the use of 2160p 30/60 FPS video, the output is H.264 – YouTube 1080p Full HD and HEVC (H.265) – 4K UHD format, and compare the output performance of pure CPU output and added GPU acceleration. The test uses an RTX 3080 Ti graphics card.
In terms of performance, the i9-13900K won the championship with 9731 points, the i7-13700K 9216 points, and the i5-13600K 9022 points. However, the performance gap is relatively small, which also shows that the main force of video and audio output work is to rely on GPU acceleration to shorten the output time. However, if the special effects of the image are not necessary for CPU operation, a high-core processor is still required for operation.
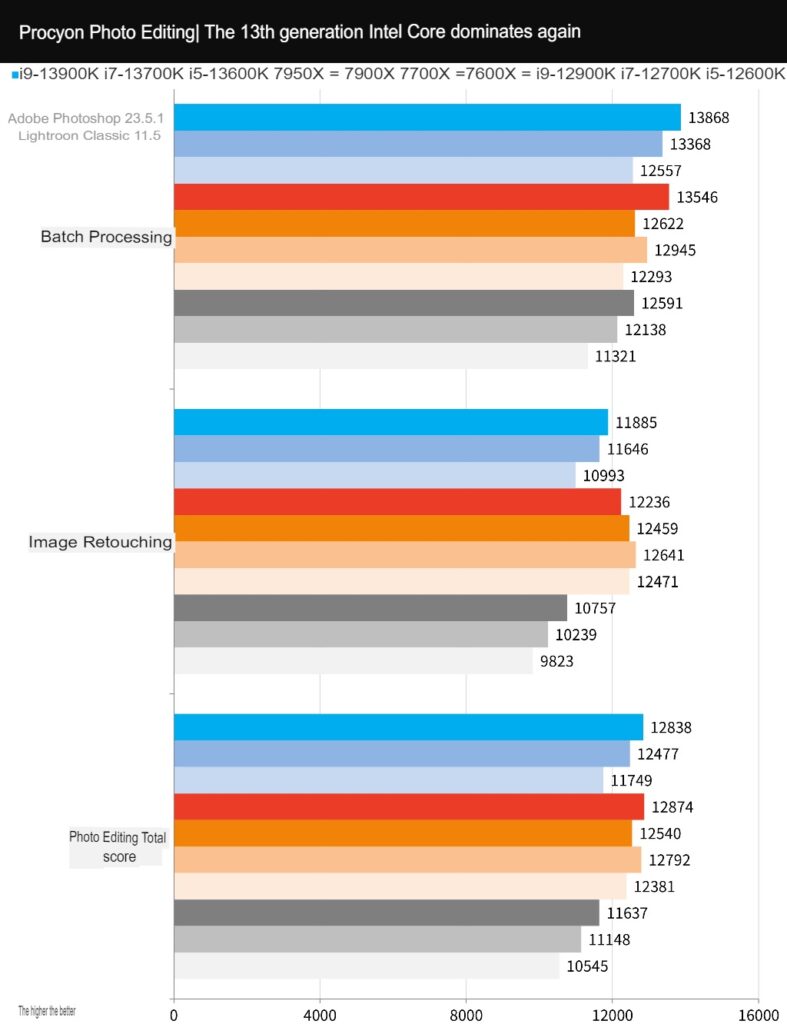
Adobe Photoshop and Lightroom Classic use the UL Procyon Photo Editing Benchmark test tool; the two working scenarios tested, the Image Retouching test is to use Photoshop for photo editing and records the time of each step, while the Batch Processing test is batch processing Use Lightroom to adjust and export a large number of photos.
From the total score, i9-13900K 12838 points, i7-13700K 12477 points, and i5-13600K 11749 points. It’s just that this project has the advantage of Ryzen performance. Photo editing and batch output tests relatively rely on CPU cores and clocks.
AIDA64 processor memory, 7-Zip compression test
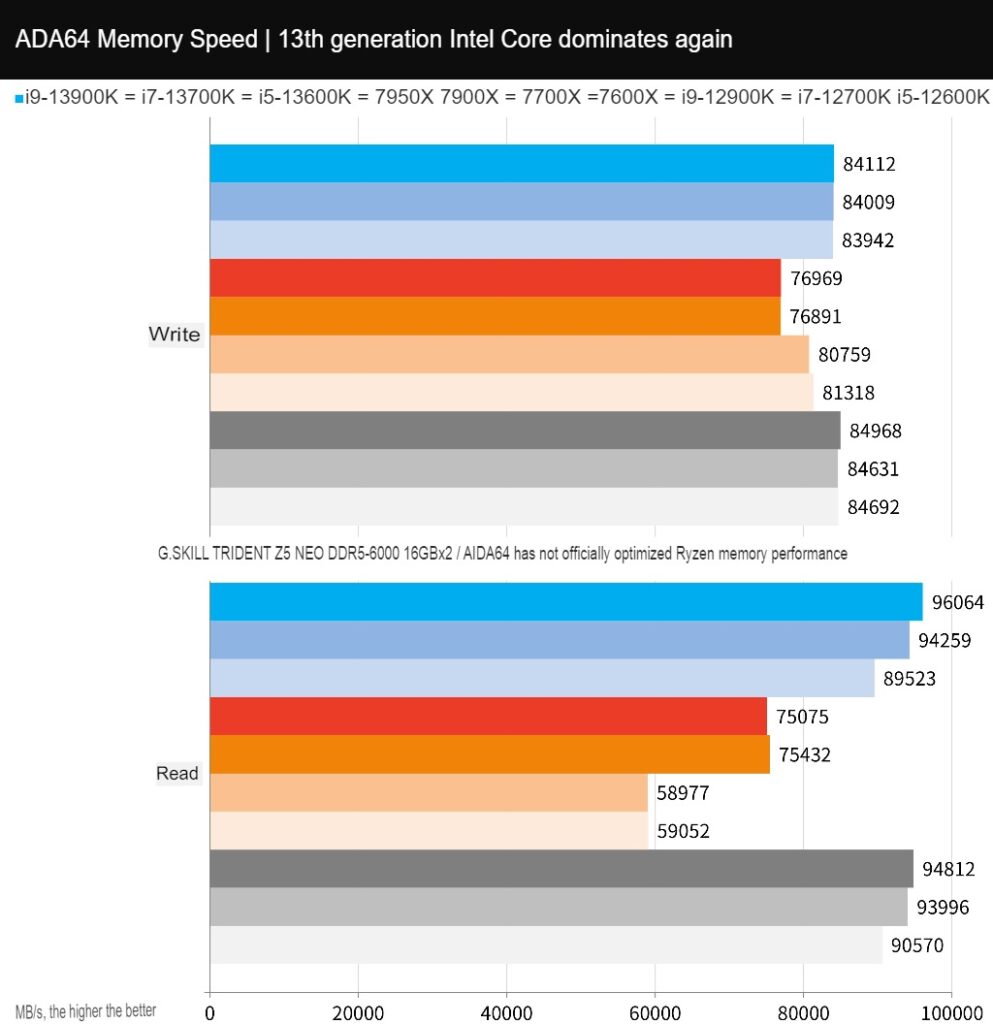
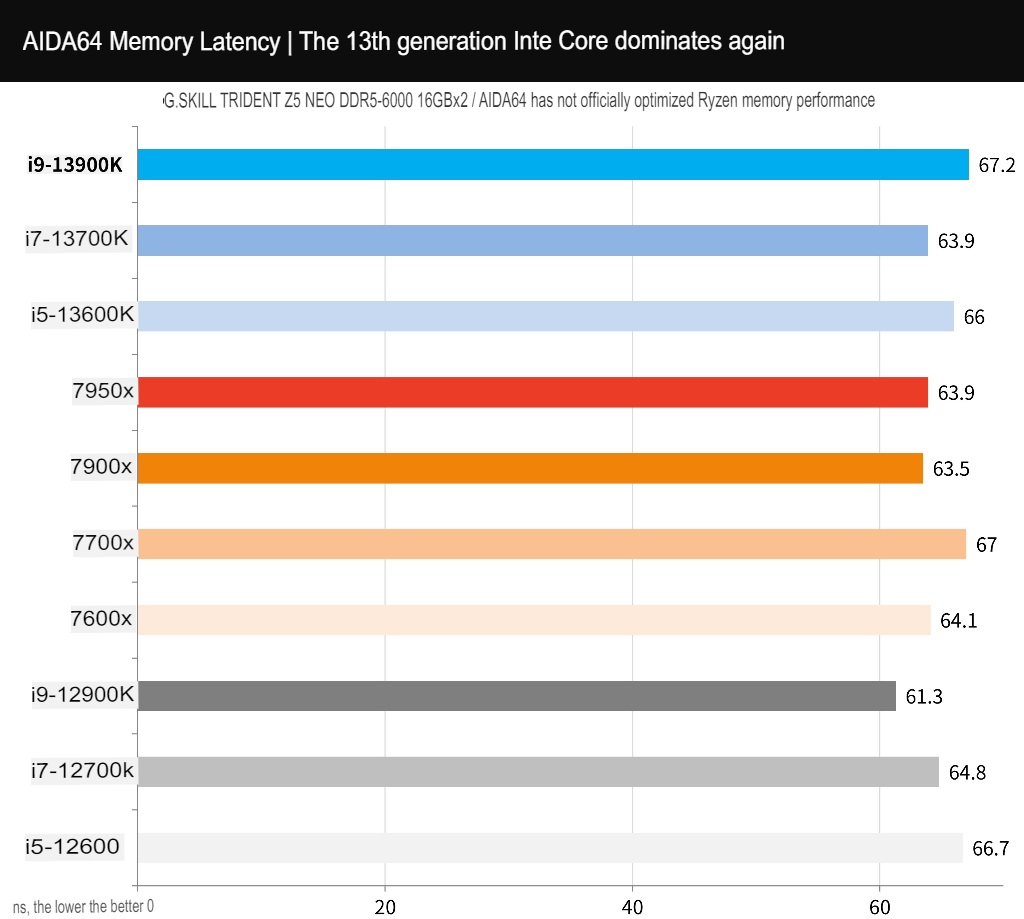
Memory test is carried out using AIDA64, but AIDA64 has not been officially optimized for Ryzen 7000 processor, so there should be room for improvement in the test memory read and write performance.
In terms of memory performance, the memory bandwidth of the 13th generation Intel Core processor test is comparable to the previous generation, but overall it is still better than Ryzen.
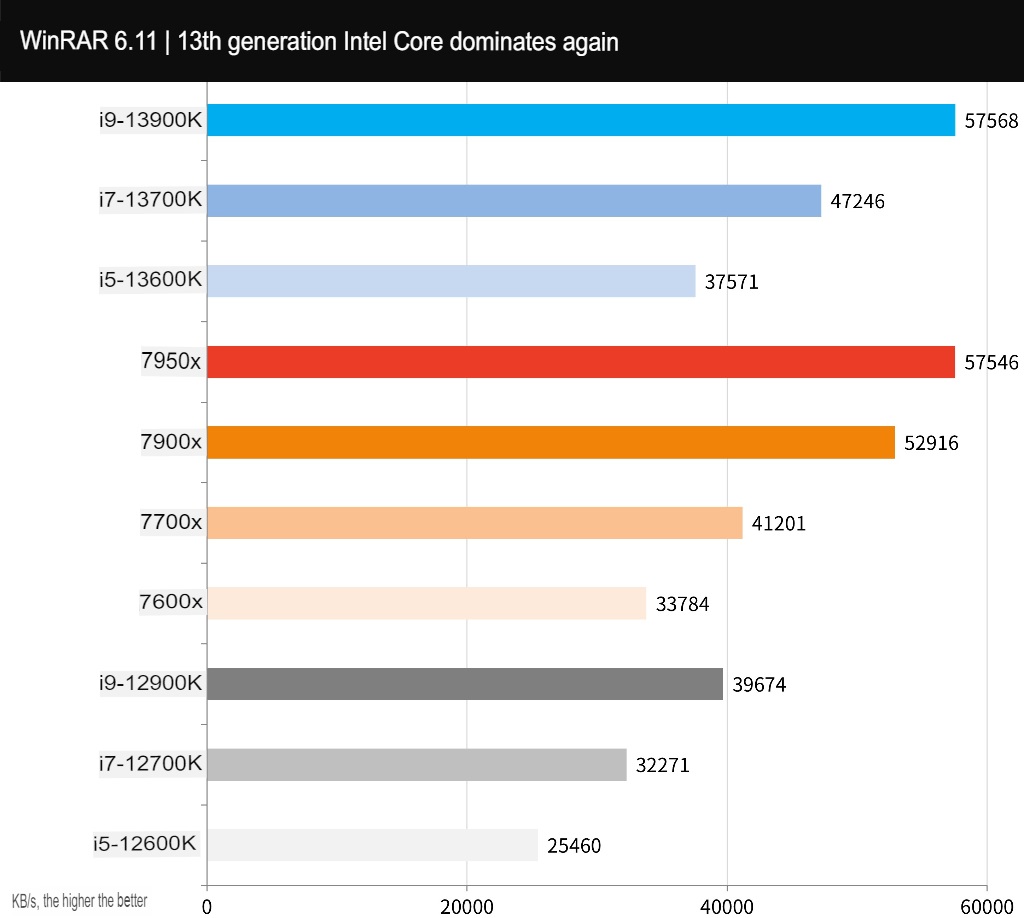
WinRAR is the most commonly used compression tool. The performance of i9-13900K can reach 57568 KB/s, which is equivalent to 7950X, i7-13700K is 47246 KB/s, and i5-13600K is 37571 KB/s.
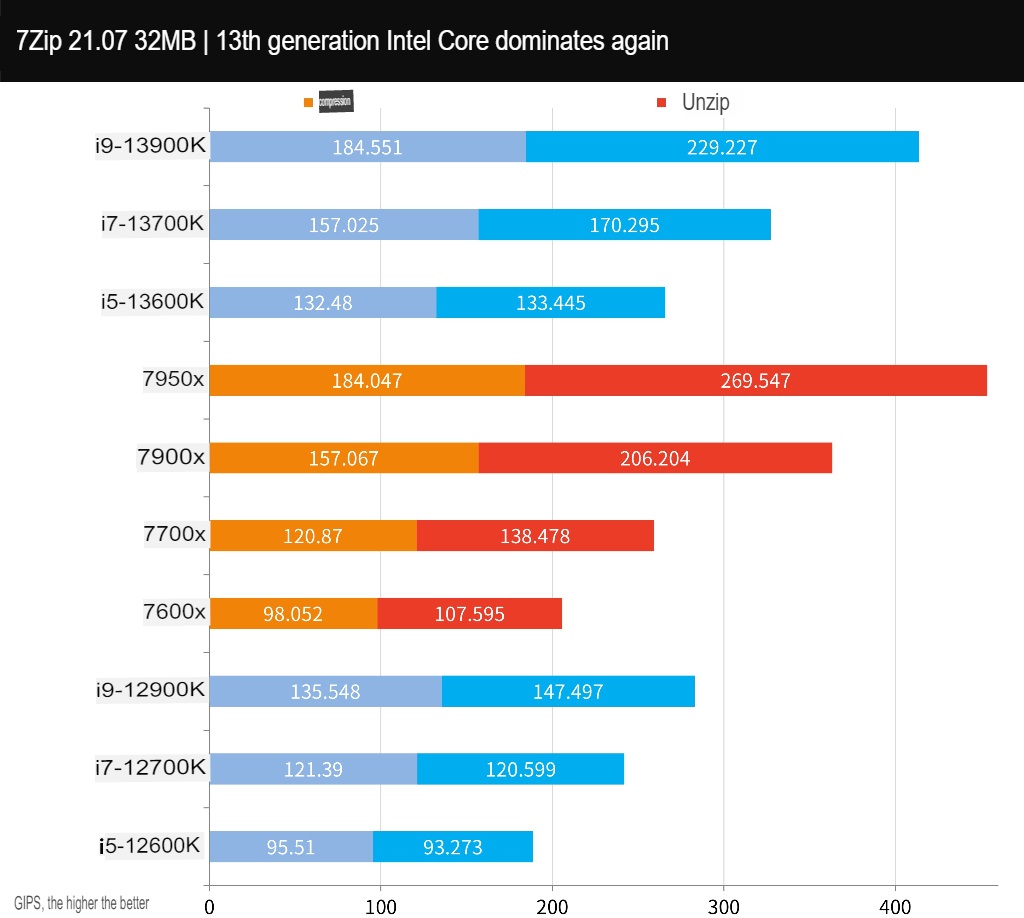
7-ZipAnother well-known and free compression tool that can effectively utilize multi-core performance. In terms of GIPS performance of compression and decompression, this project is still the 7950X champion, but the i9-13900K also recovers a lot of compression and decompression performance.
PCMark 10, CrossMark and Office computer performance test
The overall performance of the computer is first tested with PCMark 10 Express, which can be used for the basic computer work of Essentials, such as app startup speed, video conferencing, and web browsing performance. Sheets and paperwork for test items.
The i9-13900K scored 7161 points, the i7-13700K scored 7319 points, and the i5-13600K scored 7047 points. However, this test did not measure the performance improvement of the 13th generation, and the 7950X is still the champion of this project.

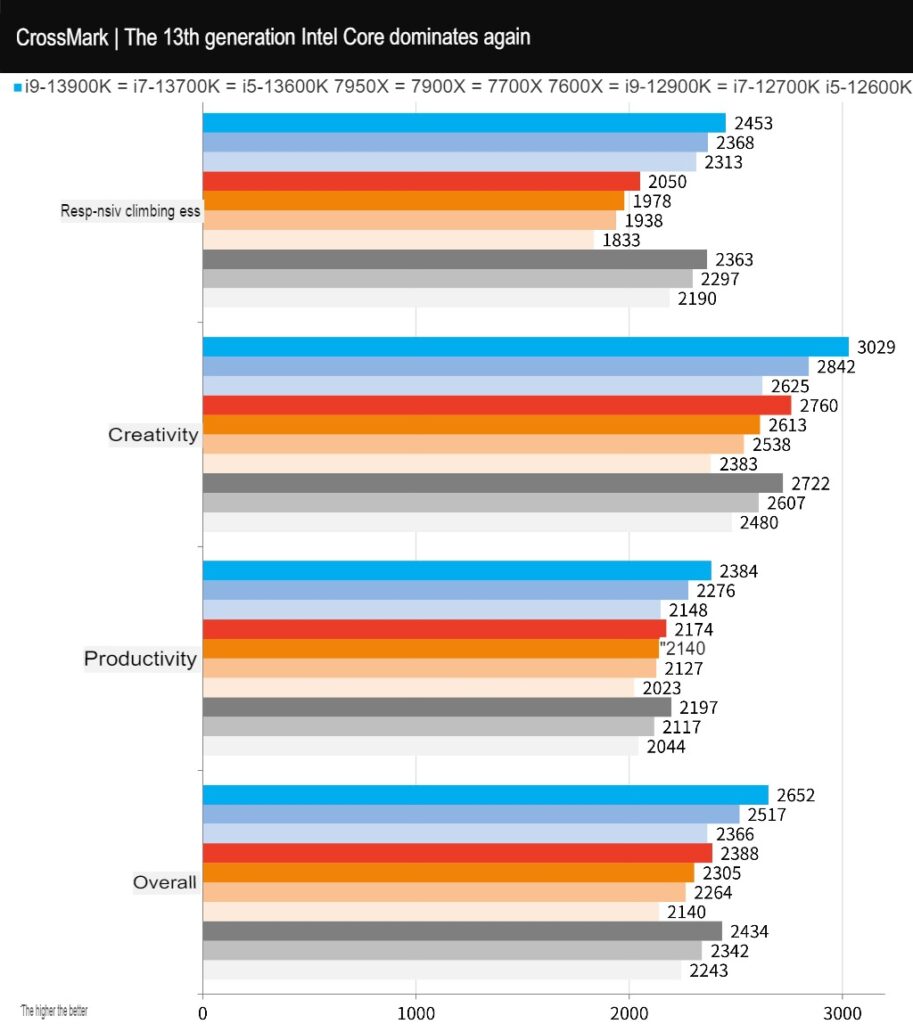
CrossMark, a cross-platform computer performance testing tool, is a free testing tool developed by BAPCo. It supports platforms such as Windows, iOS/iPadOS, macOS, and Android, and is aimed at computer productivity, such as text editing, spreadsheets, web browsing, Creative photo editing, organizing and video editing work, plus computer response speed for testing.
The i9-13900K scored 2652 points, the i7-13700K scored 2517 points, and the i5-13600K scored 2366 points. This project is Intel’s own test, and the overall computer performance of the 13th-generation processor has been slightly improved.
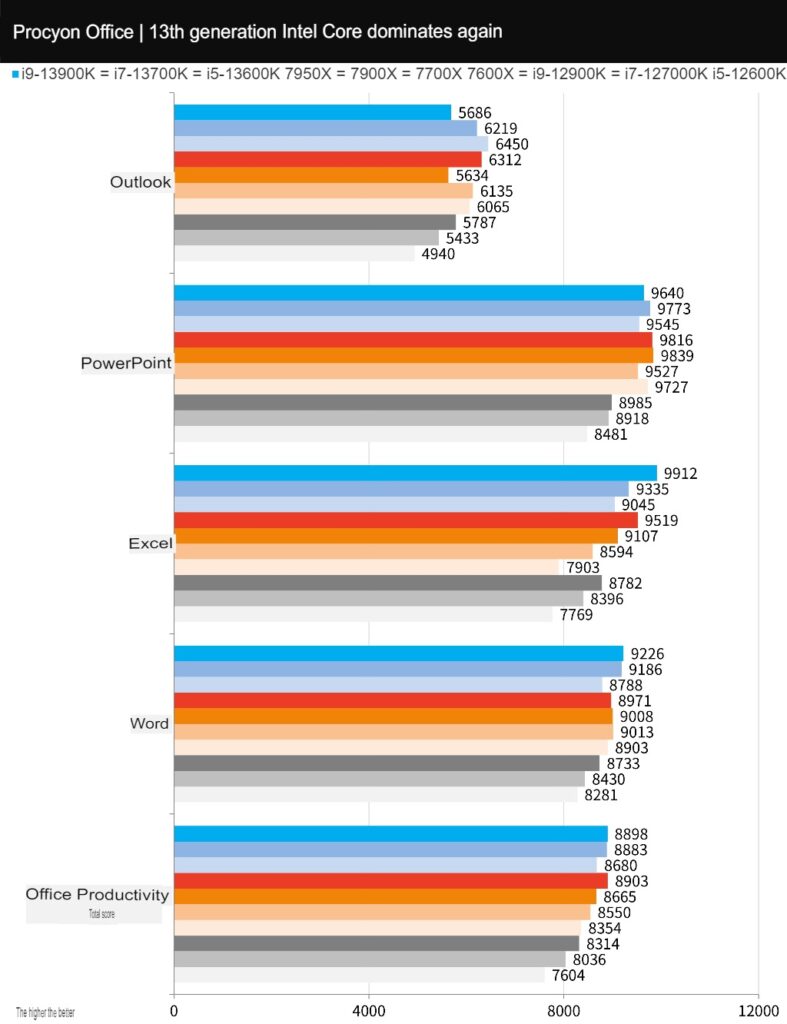
UL Procyon office productivity benchmark uses Microsoft Word, Excel, PowerPoint and Outlook to test the practical and real performance of Windows computers in daily work, and design test scenarios with common paperwork, from document opening, copying, input, trial calculation Calculation, sorting, exporting of tables, adding files, pictures, videos and emails to and from presentations, etc.
In the test, the i9-13900K achieved 8898 points, the i7-13700K 8883 points, and the i5-13600K 8680 points. The overall score seems to be that the Ryzen 7950X has a higher score, and the most upgraded version of this generation must be the i5-13600K, but these processors tested must be able to handle daily Office work with ease.
3DMark CPU performance and FS, TS benchmarks
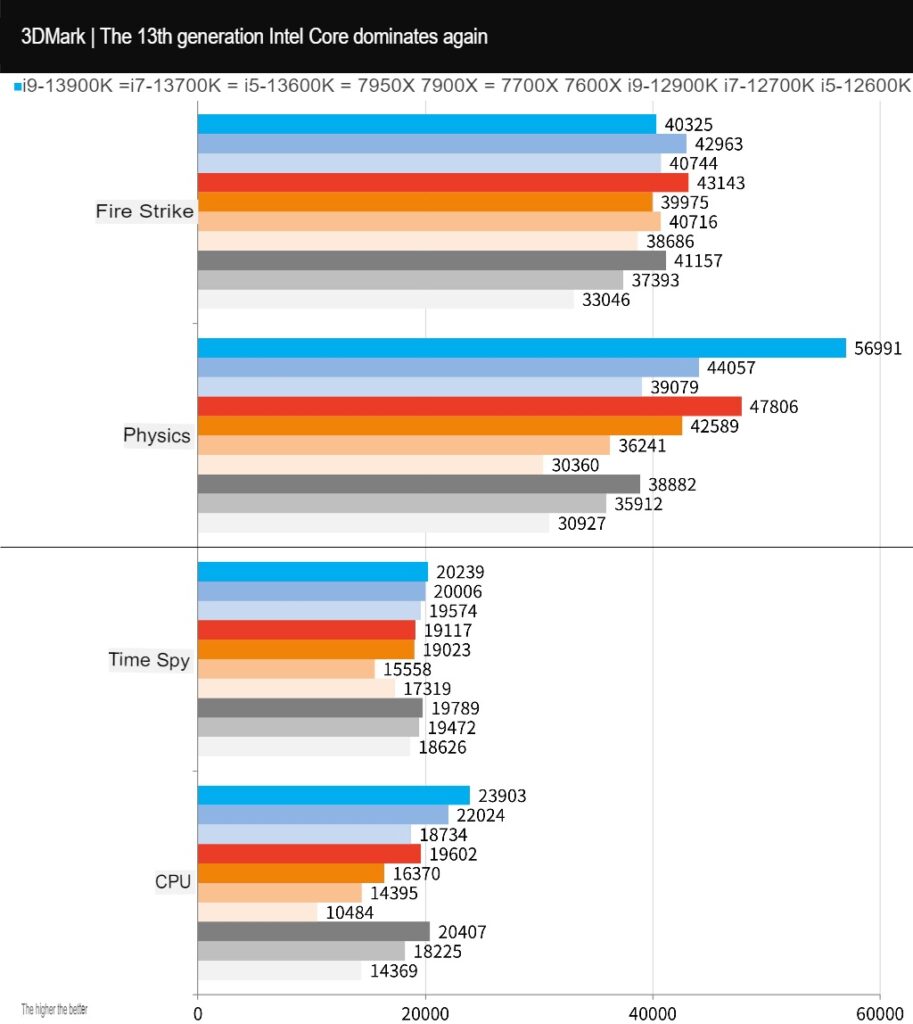
Computer graphics game performance testing tool 3DMark, the mainstream Direct X11 test Fire Strike and Direct X12 Time Spy test.
First of all, the Fire Strike physical score of DX11 is a bit like a big fight. The i9-13900K achieved a score of 56991 points, and the performance ladder of each company is relatively clear.
However, the Time Spy CPU test of DX12 is more valuable, with i9-13900K CPU 23903 points, i7-13700K CPU 22024 points, and i5-13600K CPU 18734 points. performance,
Time Spy CPU performance comparison, i9-13900K is 22% higher than 7950X and 17% higher than the previous generation i9-12900K; while i7-13700K is 35% higher than 7900X and 8% higher than i9-12900K; while the i5-13600K is 30% more than the 7700X and 79% more than the 7600X.
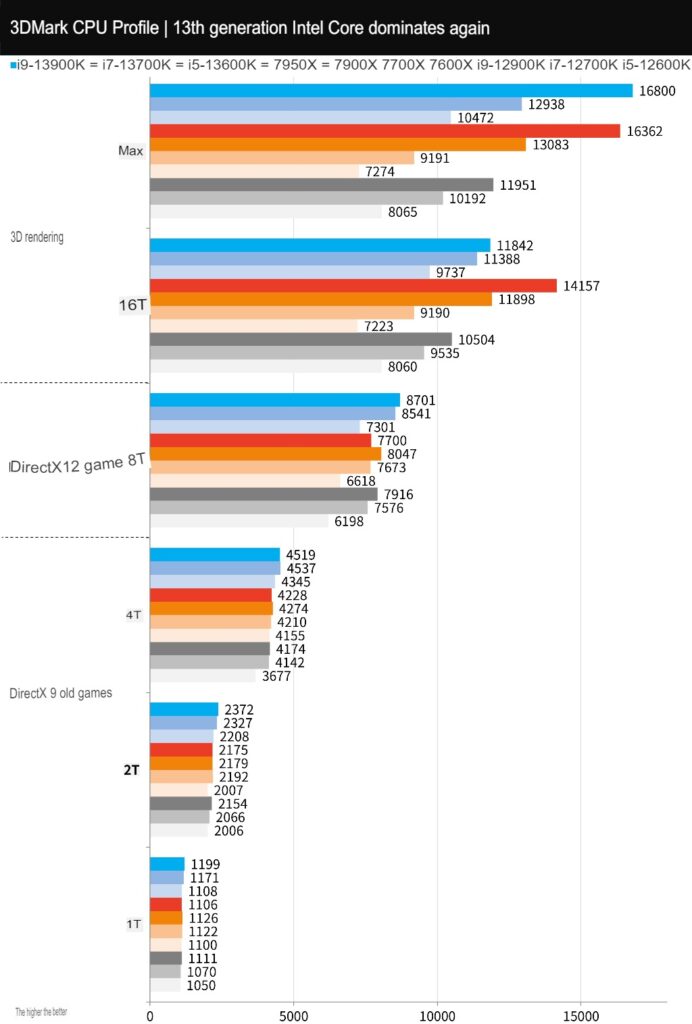
The 3DMark CPU test mainly tests the physical operation and custom simulation of the CPU and tests the performance of 1, 2, 4, 8, 16 and the maximum thread of the processor respectively, and the performance of more than 16 threads will belongs to 3D Rendering, audio and video output will be used. Generally, Direct X12 games prefer 8T threads, and the following threads are the preferences of old games.
The processor performance on the 1T-4T test is pretty close, but at 8T the i9-13900K has 8701 points, the i7-13700K is pretty close with 8541 points, and the i5-13600K is 7301 points. But what is interesting is that the 7950X has better performance in 16T, but it is still suppressed by the i9-13900K in MAX.
9+2 AAA e-sports games test processor performance
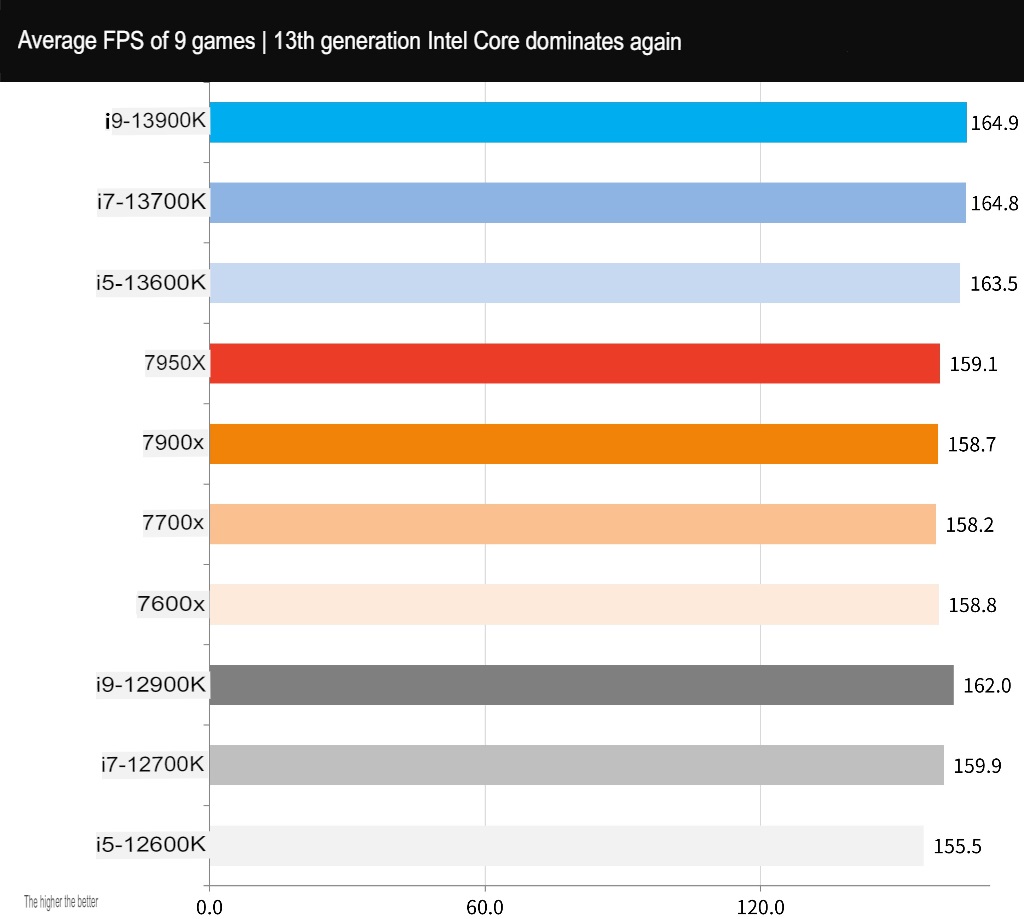
9 AAA game performance tests, including the entry-level “F1 2020” racing game, the adventure category “Tomb Raider: Shadow”, “Horizon: Expecting Dawn”, and the heavyweight Effective “Borderlands 3”, “Blood Killer 2”, “Assassin’s Creed: Viking Age”, and “Polar Trench 6”, “Marvel Interstellar” and “Electric Rider 2077″ that support light pursuit ” and other games.
All tests were conducted with In Game Benchmark at 1080p resolution and the highest default settings of the game. Except for “Electric Rider 2077” and “Marvel Star Attack Team”, DLSS acceleration was enabled, and the rest of the games did not use DLSS or FSR acceleration.
Among the 9 games, the i9-13900K averaged 164.9 FPS, the i7-13700K averaged 164.8 FPS, and the i5-13600K averaged 163.5 FPS, which was much higher than Ryzen’s highest 7950X average of 159.1 FPS.
In contrast, the i9-13900K improves the game performance by about 4% against the 7950X. This gap can be said to be quite close, but the overall average performance of the i7-13700K and i5-13600K of this generation is also closely behind the i9. But to be honest, both the 13th and 12th generation and Ryzen 7000 game performance are quite good, it depends on how you choose between multi-core, computer, game performance and price.
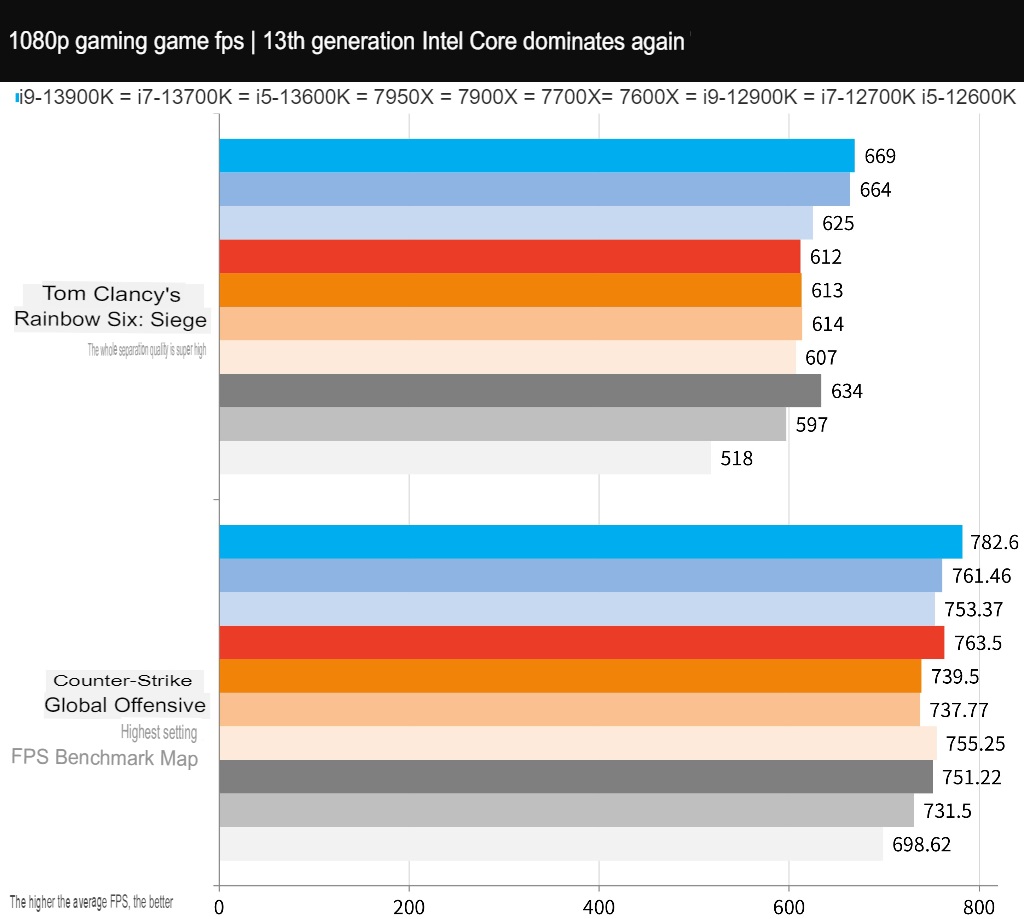
E-sports games focus on the tactical and technical competition between players and teams, so they do not require much image quality, which also allows such games to have a fairly high average FPS performance on high-end CPUs and GPUs, especially at 1080p resolution. , for the improvement of CPU performance and clock, it can increase the FPS performance of the game.
The test used two games, “Counter-Strike: Global Offensive” (CS:GO) and “Tom Clancy’s Rainbow Six: Siege” (R6), and tested at 1080p resolution and the highest settings of the game.
CS:GO games i9-13900K average 782.6 FPS, i7-13700K average 761.46 FPS, i5-13600K average 753.3 FPS; while R6 is i9-13900K average 669 FPS, i7-13700K average 664 FPS, i5-13600K average 625 FPS, All Ryzen processors that beat the comparison.
i9-13900K, i7-13700K, i5-13600K processor temperature and power consumption test / super enthusiastic!
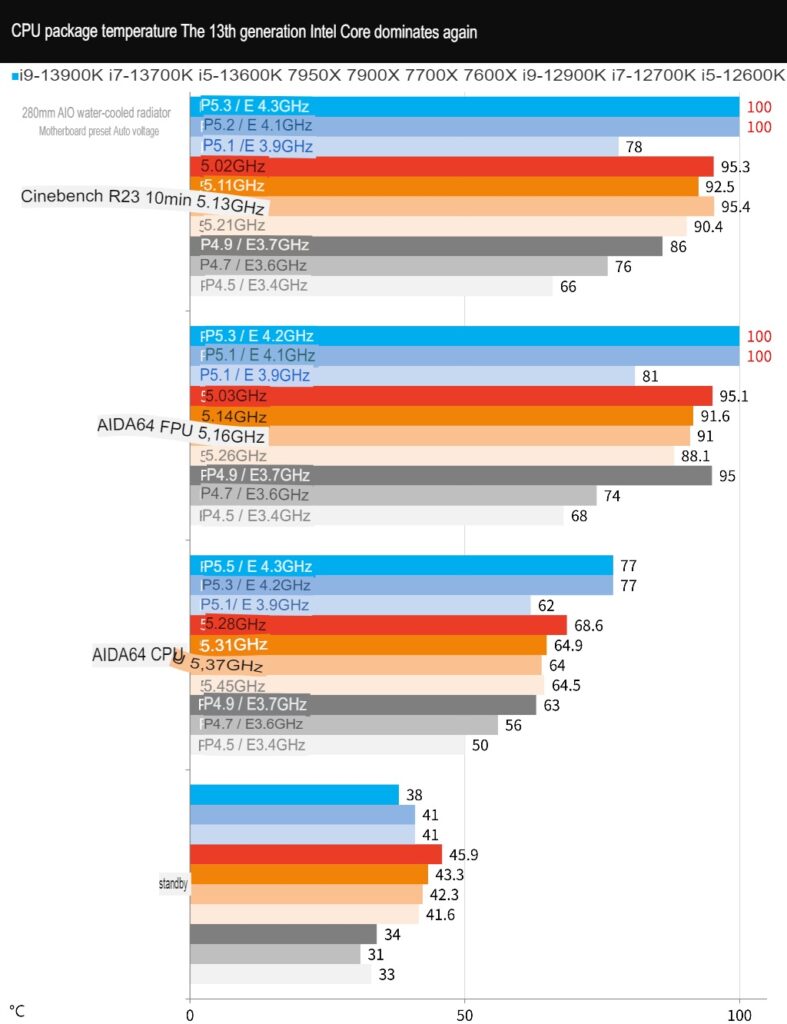
In terms of stress test, the test uses ROG STRIX LC II 280mm water-cooled radiator, fan and water pump with full speed settings, and compares AIDA64 CPU and FPU burn-in respectively; for general computer use, it is relatively close to the temperature performance of AIDA64 CPU test, while FPU test is the highest load with higher power consumption.
The AIDA64 CPU stress test is relatively close to general computer usage. The i9-13900K P5.5/E4.3GHz is pressed at 77°C, the i7-13700K P5.3/E4.2GHz is the same at 77°C, and the i5-13600K P5.1 /E3.9GHz is pressed at 62°C, which is indeed a lot higher than the previous generation.
Then under the AIDA64 FPU stress test, both the i9-13900K and i7-13700K topped 100°C and started to downgrade, the i9-13900K was down to P5.3/E4.2GHz, and the i7-13700K was P5.1/E4 .1GHz, as for the i5-13600K, the P5.1/E3.9GHz is still pressed at 81°C, which is not a temperature that can be suppressed by the 280mm AIO water cooling.
The temperature performance of Cinebench R23 is also the same as the above-mentioned FPU. The i9-13900K and i7-13700K are down to the preset upper limit of 100°C, while the i5-13600K has room to dissipate heat, so the temperature is reduced to 78°C. Of course, you will definitely want to live with the 360mm AIO total pressure! I tried it, and both i9-13900K and i7-13700K under the BIOS default voltage are down-clocked.
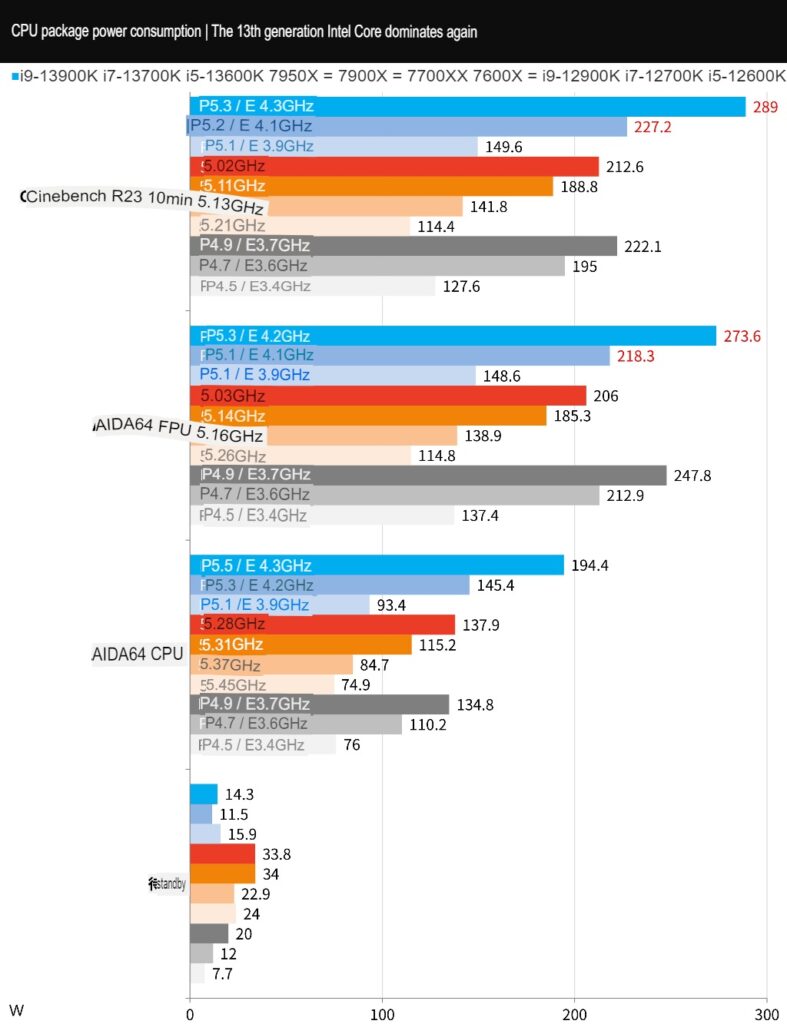
As for CPU power consumption , it is mainly based on CPU Package Power. Under AIDA64 CPU test, i9-13900K 194.4W, i7-13700K 145.4W, i5-13600K 93.4W; FPU power consumption i9-13900K 273.6W, i7-13700K 218.3W , i5-13600K 148.6W, not to mention Cinebench R23 power consumption i9-13900K runs at 289W, i7-13700K 227.2W, i5-13600K 149.6W.
From this comparison, it can be seen that the performance and power consumption ratio brought by Ryzen 7000 is still better than that of the 13th generation Intel Core. Perhaps one day Intel is willing to give TSMC a foundry for this power consumption result to change.
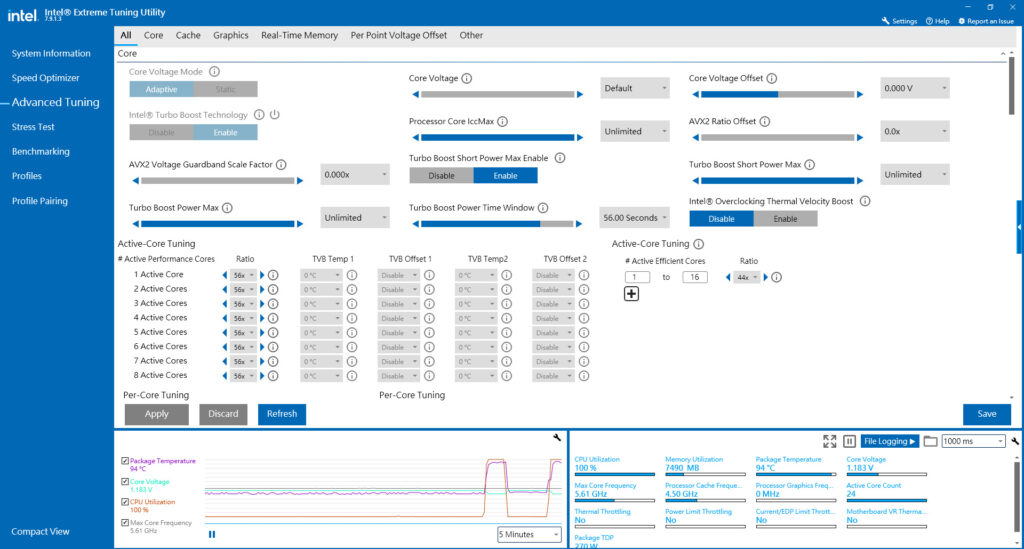
TjMAX 100°C is difficult to understand and Offset voltage makes the temperature better
Although the default i9-13900K and i7-13700K are replaced by 360mm AIO water-cooled radiators, it is the fate of topping down to 100°C, but the manual overclocking i9- The 13900K full-core P-Core 5.6GHz / E-Core 4.4GHz, voltage 1.475V can still pass the Cinebench R23 test, and the temperature limit of the frequency reduction will not be reached in a single test.
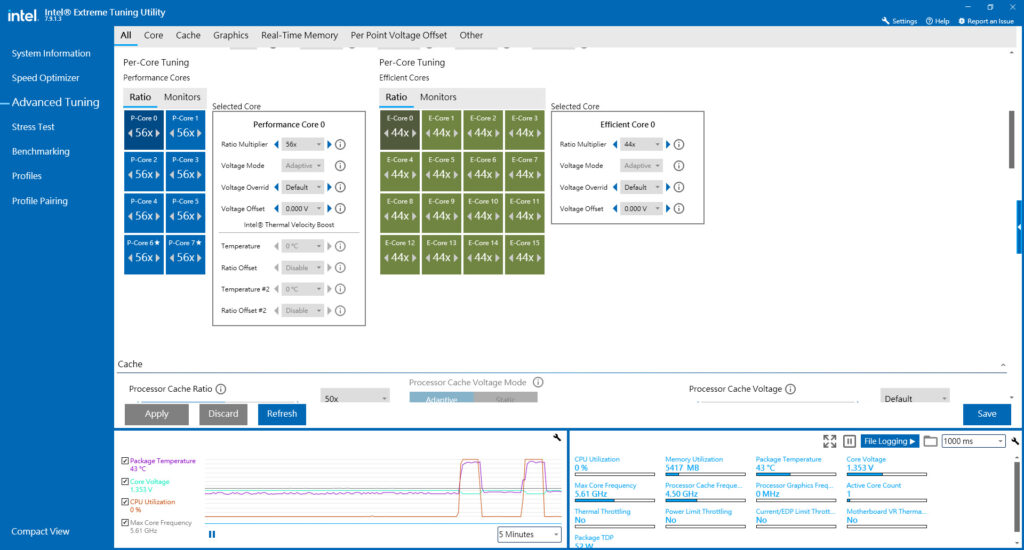
As for the i7-13700K, it is the recommended full-core P-Core 5.5GHz / E-Core 4.3GHz, and the i5-13600K recommends the P-Core 5.5GHz / E-Core 4.2GHz all-core overclocking recommended value. However, in the overclocking setting, it is recommended that players still overclock in the way of By Core Usage. For example, the overclocking of all-core 5.6GHz, 5-core 5.7GHz, and 3-core 5.9GHz is recommended.
But if you don’t want to exceed the limit, you can actually set the Vcore voltage Offset -0.1 to make the processor have better temperature performance in general use.
To sum up
The 13th generation Intel Core processor with higher Turbo, all-core clock, doubled E-Core core and increased L2 cache, once again dominates the double champion of multi-core and game performance, this generation i9- Compared with the previous generation i9-12900K, the 13900K has nearly 47% multi-core performance and 12% single-core performance upgrade, while the daily work tests such as creation, writing, and computer performance are about 7-10%. As for the game performance, it is similar. But still, beat the opponent 7950X.
As for the i7-13700K, it is undoubtedly the previous generation i9-12900K. In contrast, the multi-core performance is increased by 11%, the single-core performance is 4%, and the rest of the tests have a 2-7% performance improvement. Of course, from the above test, the i9-13900K can undoubtedly beat the 7950X, and the i7-13700K also suppresses the 7900X.
Then the mainstream entry-level Intel only needs to rely on the i5-13600K. Compared with the previous generation i5-12600K, it has nearly 41% multi-core performance and 5% single-core performance upgrade, and daily work tests such as creation, writing, and computer performance are about Between 5-11%, the game performance is similar, but there is a 13% increase in e-sports games.
The point is that an i5-13600K can beat the 7700X and 7600X, and when the default clock is low, manual overclocking by Core Usage is required to get better performance. This also makes it difficult for AMD to compete with the multi-core advantage of Intel’s hybrid architecture in the mainstream, high-end 6-core and 8-core markets.

However, the 13th generation Intel Core processor is hotter than the previous generation, and the motherboard defaults i9-13900K, i7-13700K dual-top to TjMax 100°C to reduce the frequency, so it is recommended that players not only use 360mm AIO water cooling, You can also try the Vcore voltage setting of about Offset -0.1 so that the overall temperature can be better controlled; of course, Intel also won the first place in the power consumption section, which is also a necessary evil that this generation must carry.
However, the first wave of pre-order prices announced by the first wave of original price houses are higher, i9-13900K NT$22690, i7-13700K NT$15690, i5-13600K NT$11290, which is indeed much higher than the US dollar price, but now Taiwan is curved There are still 12th-gen processors on sale, so the 13th-gen is more expensive to compete with the new Ryzen 7000, while players who want a more cost-effective option can opt for the 12th-gen processors.
In this year’s multi-core war, the strongest game processor is nothing more than the Intel Core i9-13900K. Next year, Intel plans to launch the 6GHz i9-13900KS processor, depending on how AMD will counterattack with a strategy.

If this article is helpful for you, please share this article with your friends on social media. Thank you!!
This article is based on the personality of the reviews. You are responsible for fact-checking if the contents are not facts or accurate.
Title: Intel Core i9-13900K, i7-13700K, i5-13600K test report / boosting E-core to boost the clock