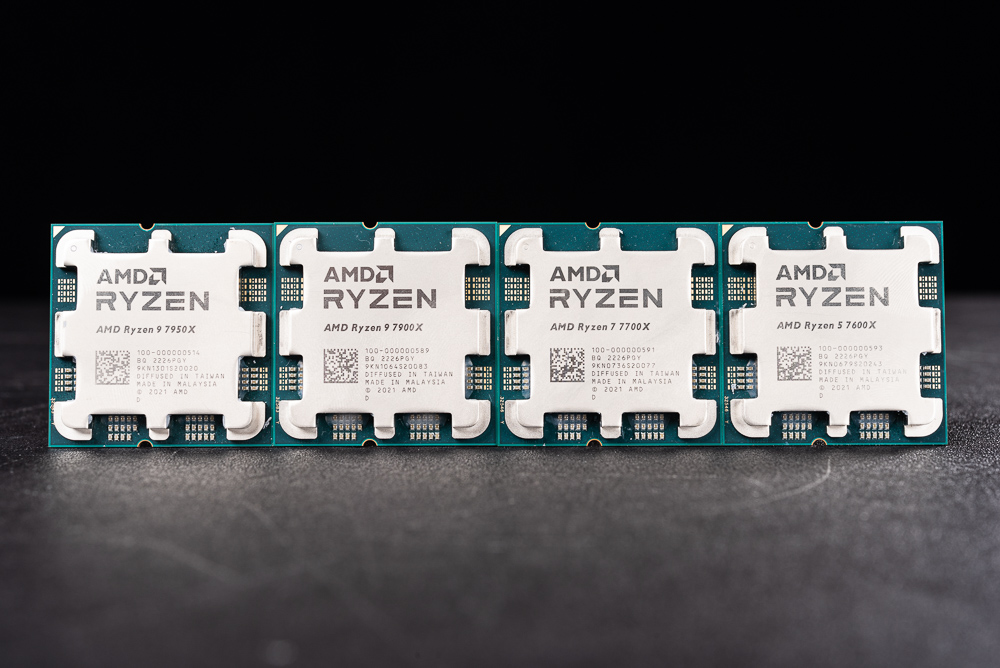
AMD’s new generation 5nm, Zen 4 architecture Ryzen 7000 processor, led by 7950X, brings powerful full-core 5GHz, single-core 5.7GHz Boost super performance, not only in multi-core computing, rendering and computer performance tests, can win The opponent’s i9-12900K, after the first wave of lifting the ban, then added the performance of 7900X, 7700X and i7-12700K, allowing players to fully understand the test data of Ryzen 7000 against the 12th generation Intel Core processor.
Testbed, Setup and CPU-Z
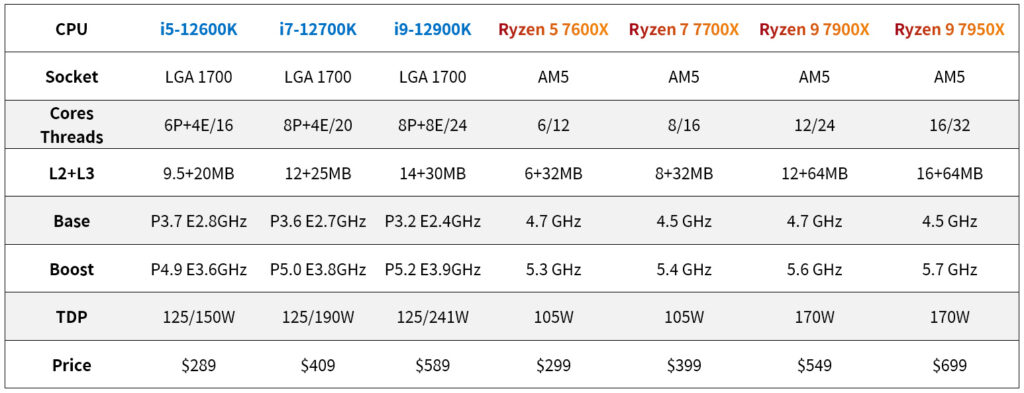
This generation of AMD’s clock boost and power consumption is undoubtedly a confrontation with Intel. The first wave of four Ryzen 9 7950X, 7900X, 7700X, and 7600X corresponds to Intel Core i9-12900K, i7-12700K, and i5-12600K processors, respectively. And also through the test to let players understand the performance of this generation of processor performance.
Use the motherboard default Auto in the test and apply the DDR5-6000 EXPO memory settings; the test platform is provided below for your reference.
Test Platform
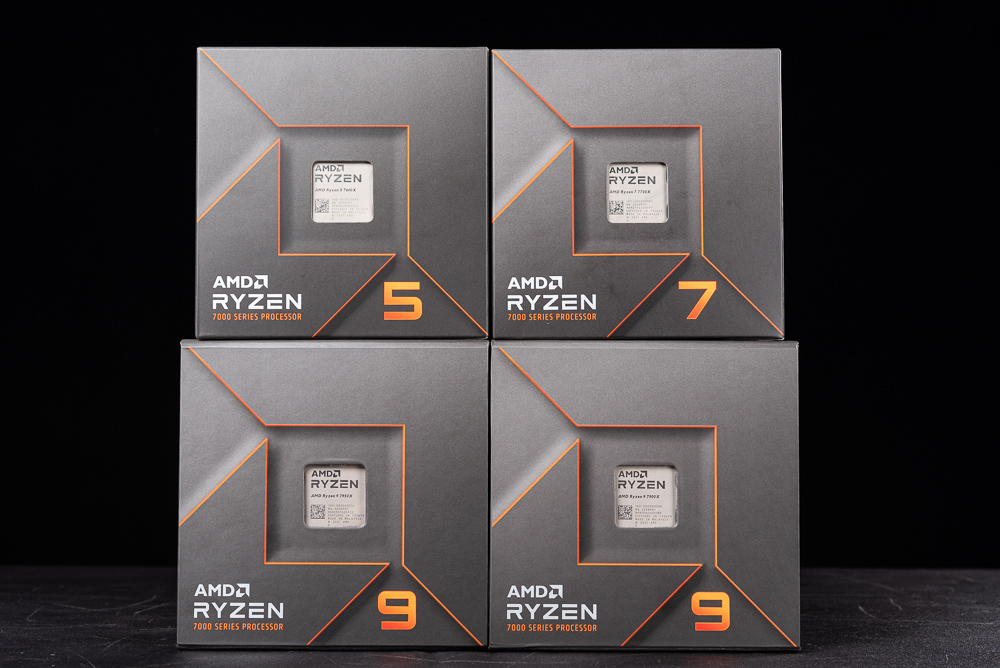
Processor: AMD Ryzen 9 7950X, 7900X, 7700X, 7600X
Motherboard: ASUS ROG CROSSHAIR X670E HERO 0604
Memory: G.SKILL TRIDENT Z5 NEO DDR5-6000 16GBx2
Graphics Card: NVIDIA GeForce RTX 3080 Ti
System Disk: Solidigm P41 Plus 1TB PCIe 4.0 SSD
Cooler: ASUS ROG STRIX LC II 280mm
Power Supply: Seasonic PRIME PX-1000
Operating System: Windows 11 Pro 21H2
Processor: Intel Core i9-12900K, i7-12700K, i5-12600K
Motherboard: ASUS ROG MAXIMUS Z690 HERO 2004 / ASRock Z690 Tiachi 11.01
Memory: G.SKILL TRIDENT Z5 NEO DDR5-6000 16GBx2
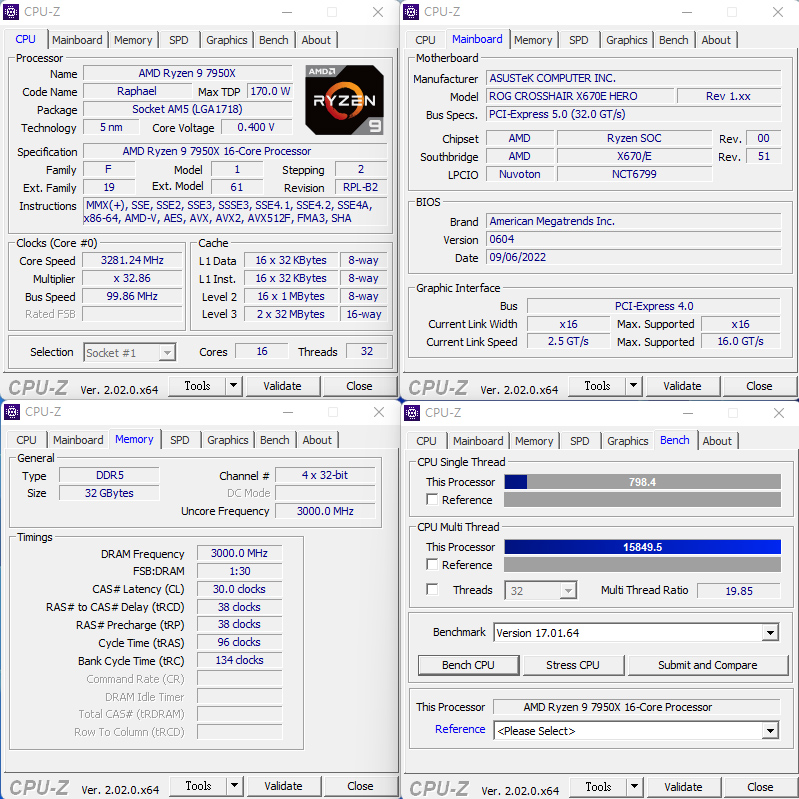
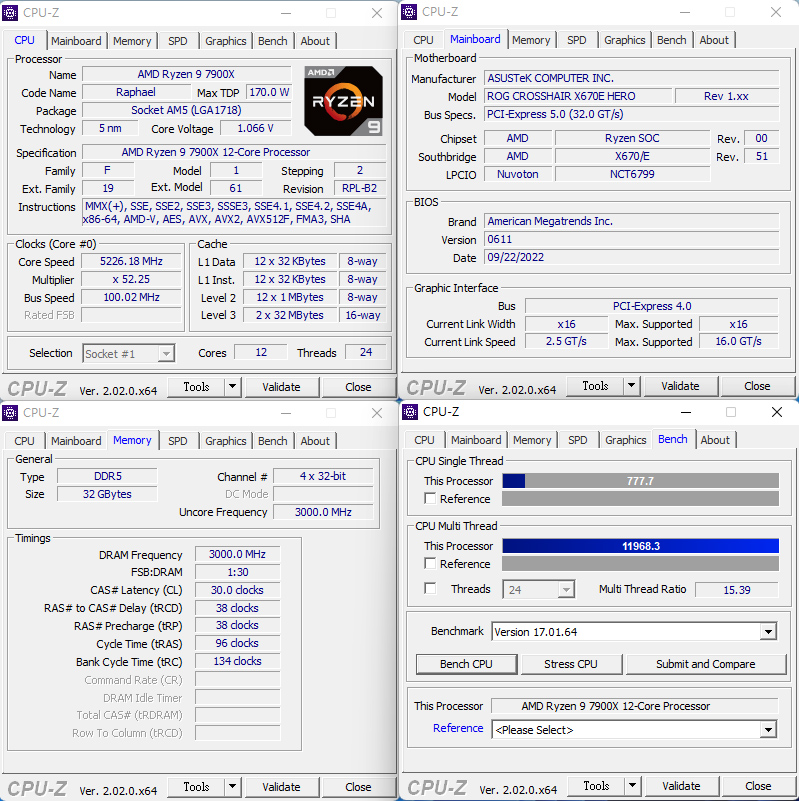
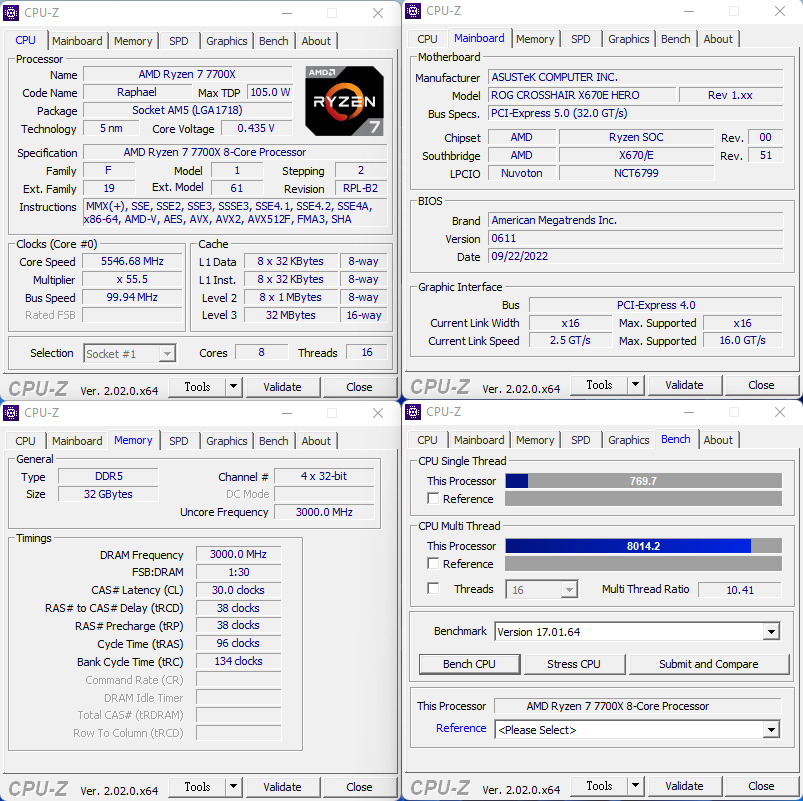
7950X CPU-Z.
Processor computing performance Cinebench, VRay rendering test
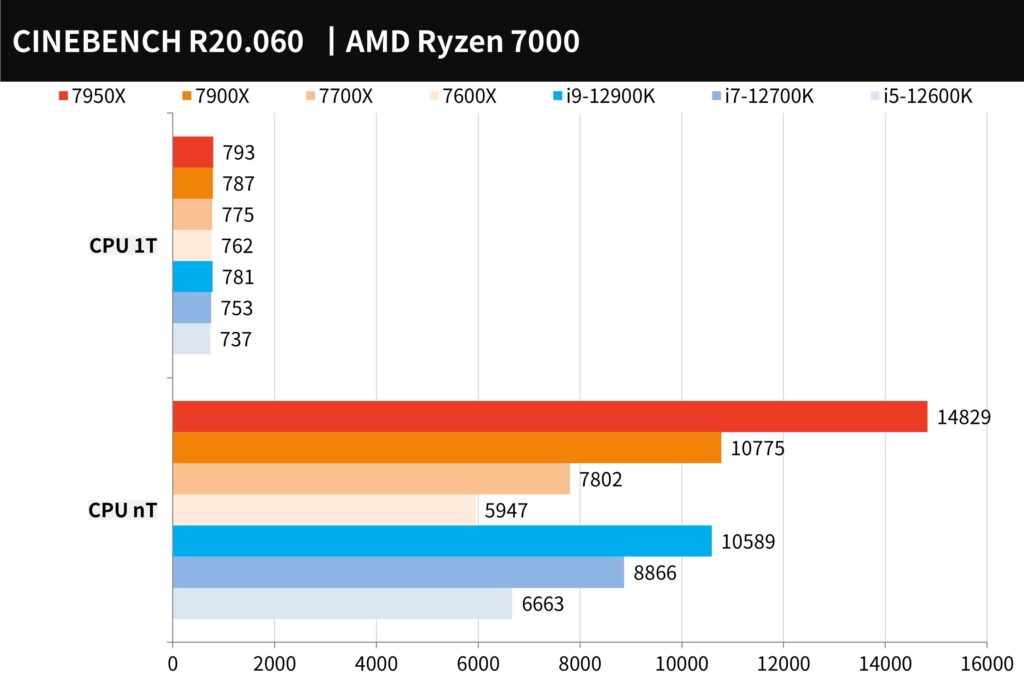
CINEBENCH R20, developed by MAXON based on Cinema 4D, can be used to evaluate the 3D rendering performance of computer processors. It is also a reliable test software that can quickly evaluate CPU multi-core computing performance.
The 7950X and 7900X nT multi-threads scored 14,829 points and 10,775 points, respectively, and beat the i9-12900K’s 10,589 points; in terms of single-thread 1T, 7950X scored 793 points, 7900X 787 points, and i9-12900K 781 points.
As for the 7700X is nT 7802, 1T 775 points, and 7600X is nT 5947, 1T 762 points.
In terms of performance, 7950X and 7900X have a 40% and 1.8% lead in multi-core compared to i9-12900K, and 1.5% and 0.8% in single-core.
However, the 7700X loses -12% against the i7-12700K multi-core, and the single-core wins by 2.9%; while the 7600X compares with the i5-12600K, the multi-core loses -10.7% and the single-core wins by 3.4%.
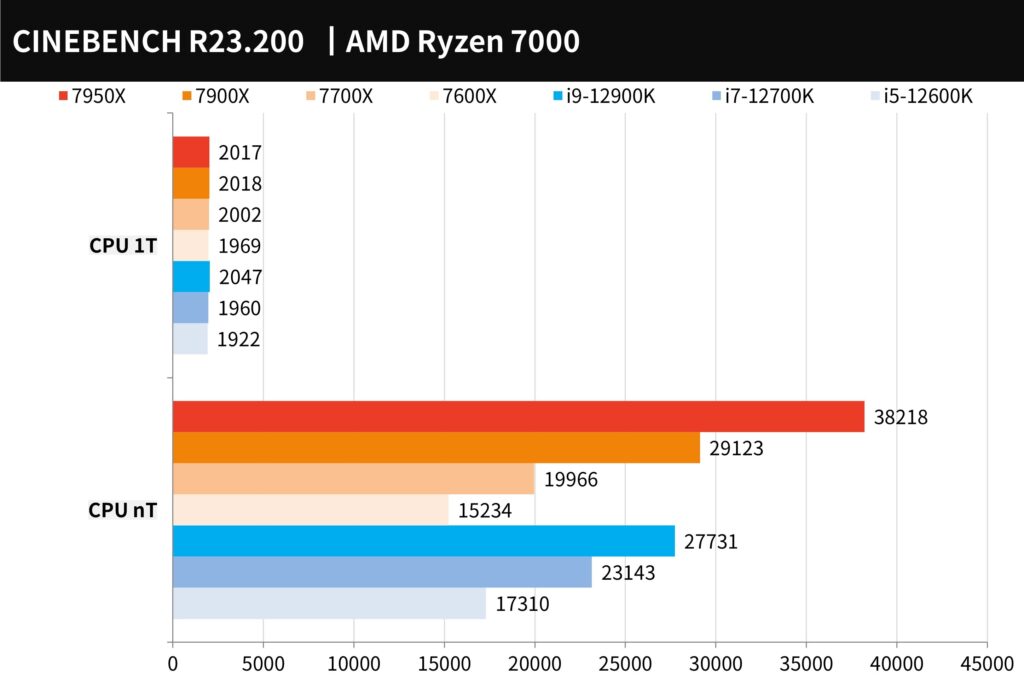
CINEBENCH R23 has the same test situation as R20. It uses a new compiler and has a stress test function. Players can customize the Minimum Test Duration time, such as 10 or 30 minutes, to test the computer’s stability; however, the results of R23 cannot be compared with R20.
The 7950X multi-threaded nT achieved 38218 points and single-threaded 2017 points, while the 7900X scored 29123 points and 1T 2018 points. As for the 7700X is nT 19966 points, 1T 2002 points, and the 7600X is nT 15234, 1T 1969 points.
In contrast, 7950X and 7900X have a 37.8% and 5% lead in multi-core compared to i9-12900K, and a small loss of -1.5% and -1.4% in single-core.
Similarly, the 7700X loses -13.7% against the i7-12700K multi-core, and the single-core wins by 2.1%; while the 7600X compares with the i5-12600K, the multi-core loses -12%, and the single-core wins by 4.4%.
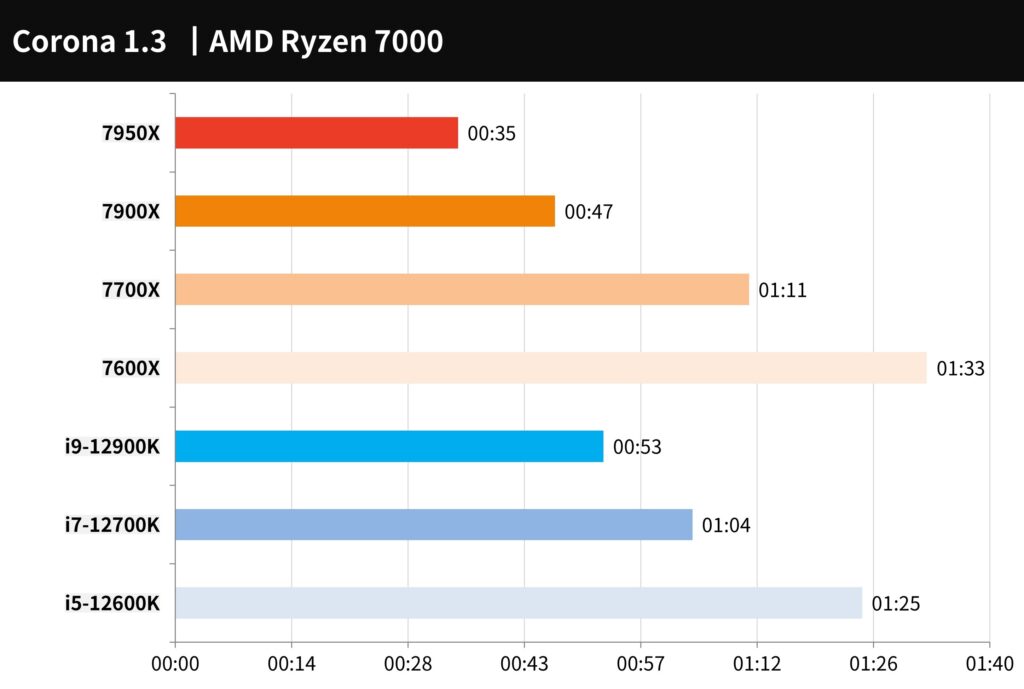
Corona Benchmark is a relatively easy-to-operate test tool, using Corona Renderer 1.3 renderer for testing, comparing the rendering speed of the processor and the performance of Rays/s, and the score is the timing in seconds.
The 7950X completed the task in just 35 seconds, while the 7900X completed it in just 47 seconds, much faster than the i9-12900K’s 53 seconds.
The 7700X is 1 minute and 11 seconds, and the 7600X is 1 minute and 33 seconds. The speed is slightly slower than the i7-12700K and i5-12600K.
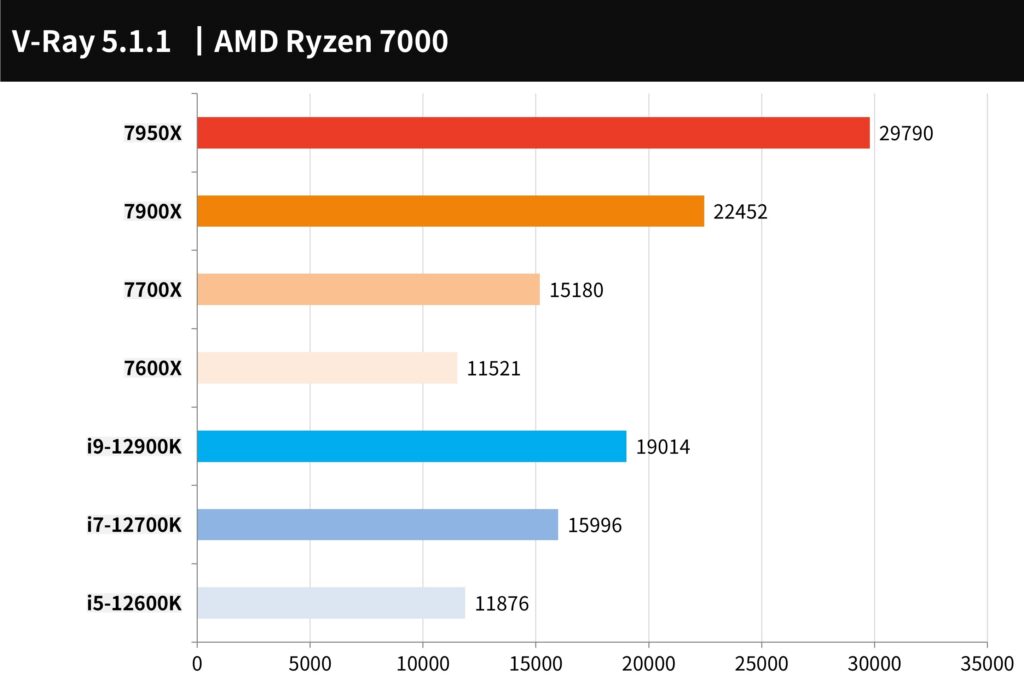
V-Ray Benchmark is developed by Chaos Group. V-Ray is a ray rendering software designed based on the laws of physics. This tool can be used for CPU performance testing of ray tracing rendered images. The CPU score is calculated in samples per second. Number as a unit.
The 7950X has a computing performance of 29,790, and the 7900X also has a score of 22,452 points, ahead of the i9-12900K’s 19,014 points. Compared with the performance, the 7950X has a 56.7% lead, and the 7900X has an 18.1% lead.
The 7700X has 15180 points, and the 7600X has 11,521 points, but it also loses to the i7-12700K and i5-12600K with a performance reduction ratio of about -5.1% and -3%.
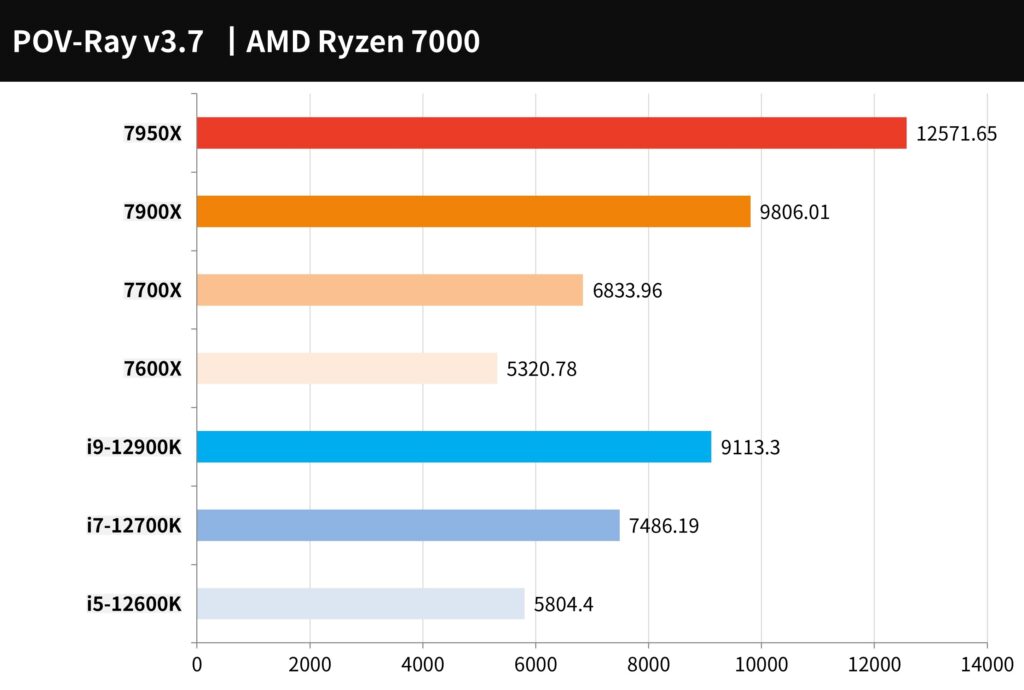
POV-Ray is another set of free ray tracing 3D rendering tools. It uses the computing power of a multi-core CPU to calculate the rendering of light and shadow and 3D images.
The 7950X won the championship with 12571 PPS, and the 7900X also had a performance of 9806 PPS, which was 37.9% and 7.6% faster than the 9113 PPS of the i9-12900K, respectively.
The performance of 7700X 6833 PPS and 7600X 5320 PPS is also slightly lower than that of i7-12700K and i5-12600K, about -8.7% and -8.3%.
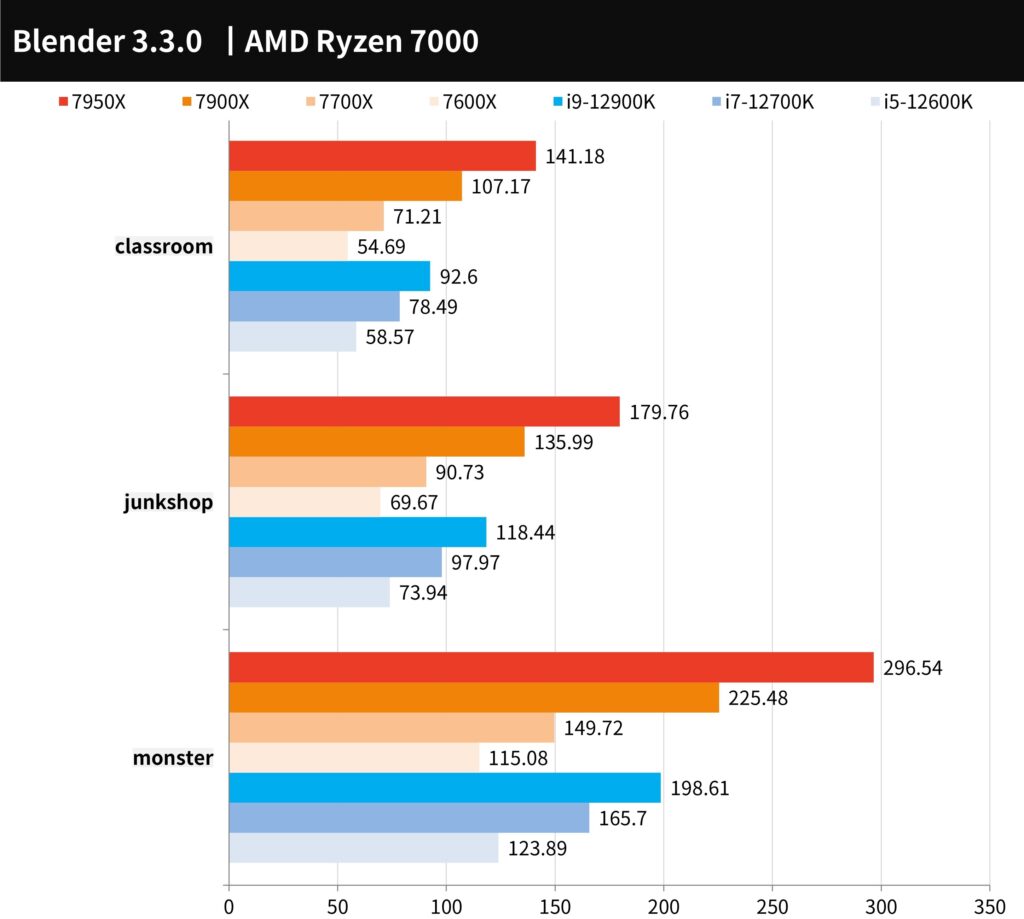
Blender is a cross-platform, open-source 3D authoring tool that supports CPU and GPU rendering acceleration and various 3D operations: Modeling, Rigging, Animation, Simulation, Rendering, Compositing, and Motion Tracking.
Through the Blender Benchmark 3.3.0 test, the 7950X has achieved quite strong results in monster, junkshop, classroom, and other scenes, and the results of this test are the same as the above-mentioned rendering test results, which are provided for your reference.
Summary: From the perspective of CPU multi-core rendering performance, Ryzen 7950X and 7900X have quite powerful multi-core performance to beat i9-12900K, but this multi-core performance can be compared to the future i9-13900K is a bit exciting.
However, the 7700X and 7600X, which have fewer cores than their opponents, cannot directly win the comparison of the i7-12700K and i5-12600K in multi-core. If the opponent’s future 13th generation processors add more E-Cores, The situation is a bit awkward for Ryzen’s high-end, mainstream processors.
Creative PR image output, LR and PS photo editing performance test
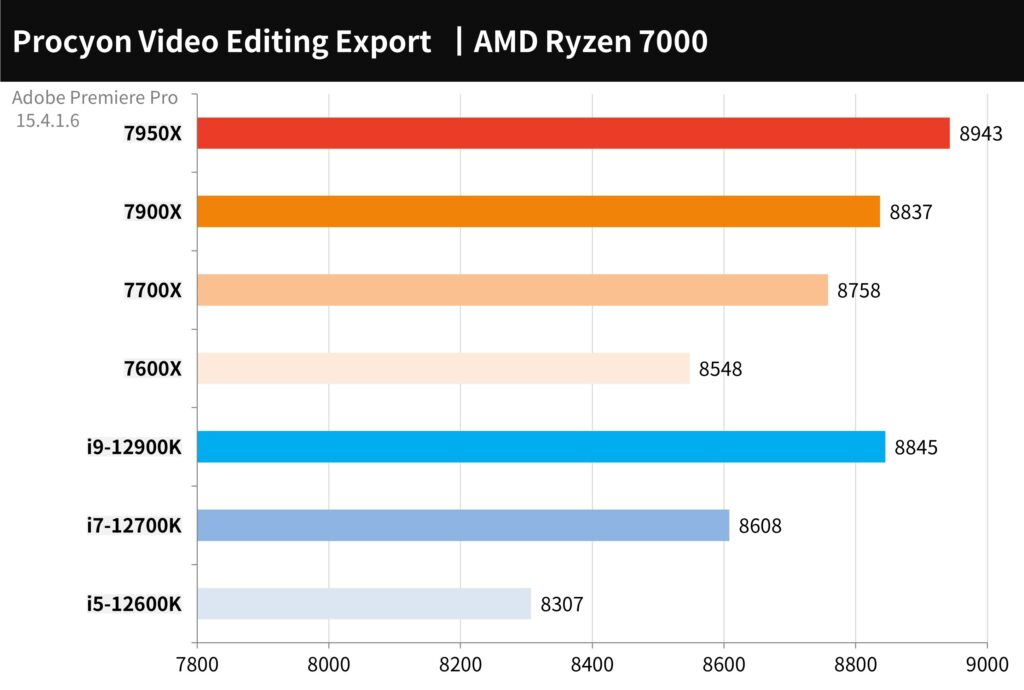
For the conversion output test of Adobe Premiere Pro 2020, this time using the UL Procyon Video Editing Benchmark test tool, the test scenario is a video using 2160p 30/60 FPS. The output is H.264 – YouTube 1080p Full HD and HEVC (H.265 ) – 4K UHD format, and compare the output performance of pure CPU output and added GPU acceleration. The test uses an RTX 3080 Ti graphics card.
In terms of performance, the 7950X won the championship with 8943 points, surpassing the i9-12900K’s 8845 points, the 7700X’s 8758 points, and 7600X’s 8548 points.
However, the performance gap is relatively small, which also shows that the main force of video and audio output work is to rely on GPU acceleration to shorten the output time. However, if the special effects of the image are not necessary for CPU operation, a high-core processor is still required.
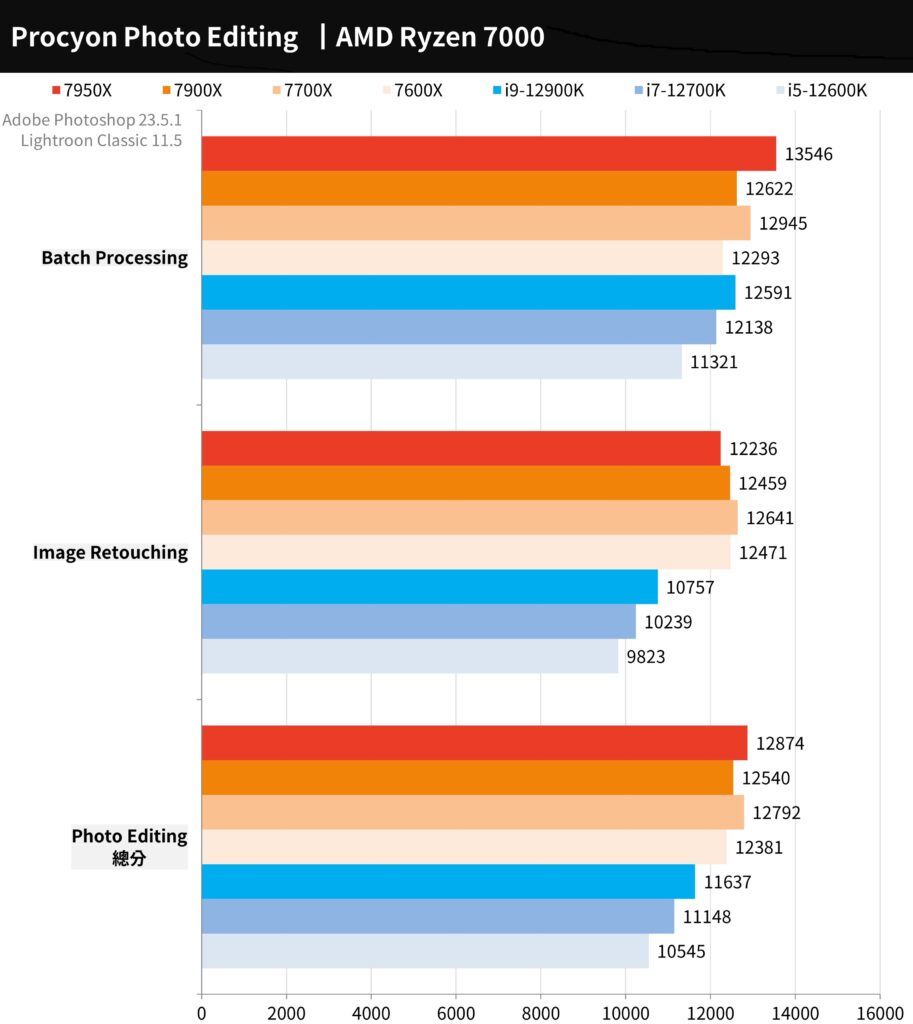
Adobe Photoshop and Lightroom Classic use the UL Procyon Photo Editing Benchmark test tool; the two working scenarios tested, the Image Retouching test, is to use Photoshop for photo editing and record the time of each step, while the Batch Processing test is batch processing. Use Lightroom to adjust and export a large number of photos.
Regarding the total score, 7950X won the championship with 12874 points, 7900X 12540 points, 7700X 12792 points, and 7600X 12381 points. From the performance point of view, 7700X must have an excellent photo editing and processing performance. Of course, this project ultimately wins Comparing Intel processors.
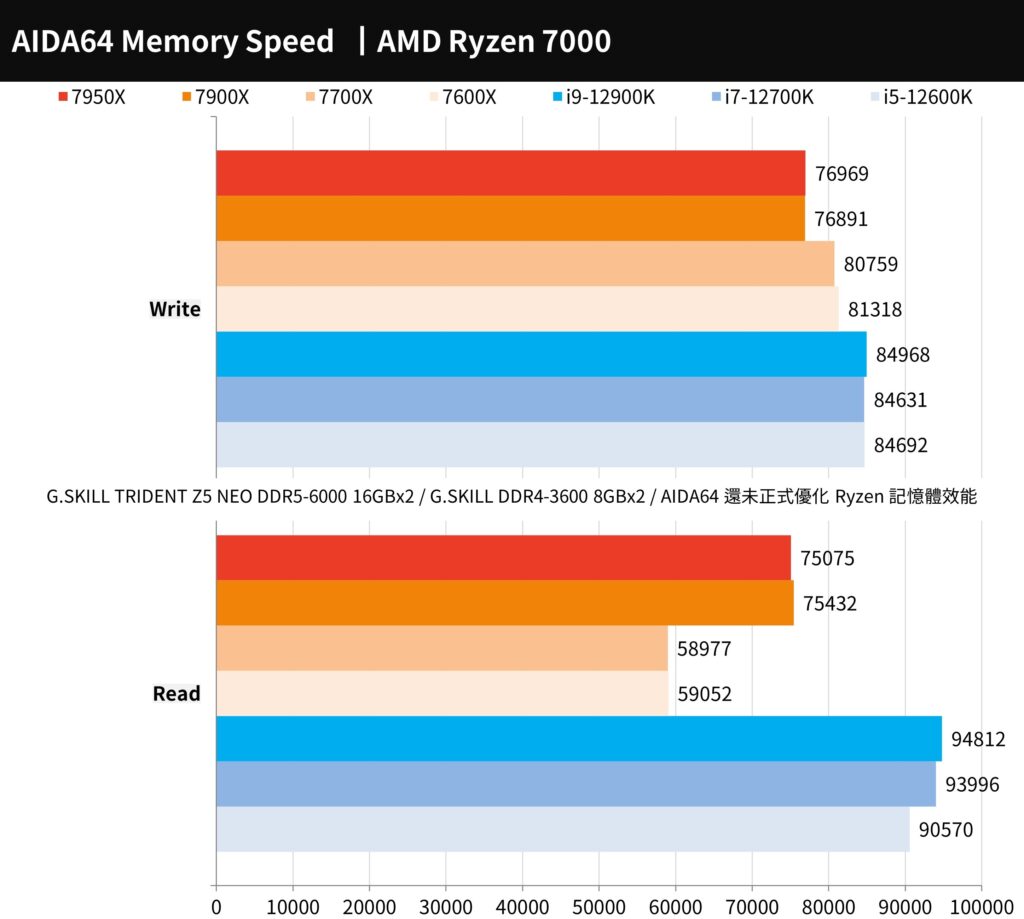
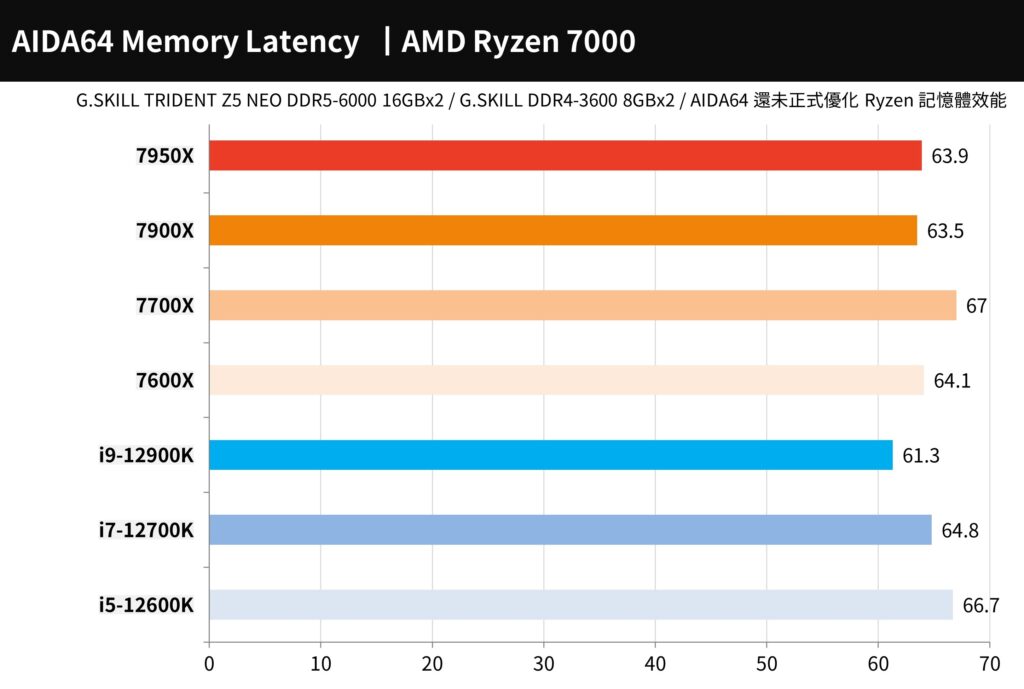
AIDA64 processor memory, 7-Zip compression test
The memory test is carried out using AIDA64, but AIDA64 has not been officially optimized for the Ryzen 7000 processor, so there should be room for improvement in the test memory read and write performance.
Therefore, the test results seem to be a bit strange. In short, the memory performance will be more accurate after AIDA64 is updated. The data is only provided for your reference.
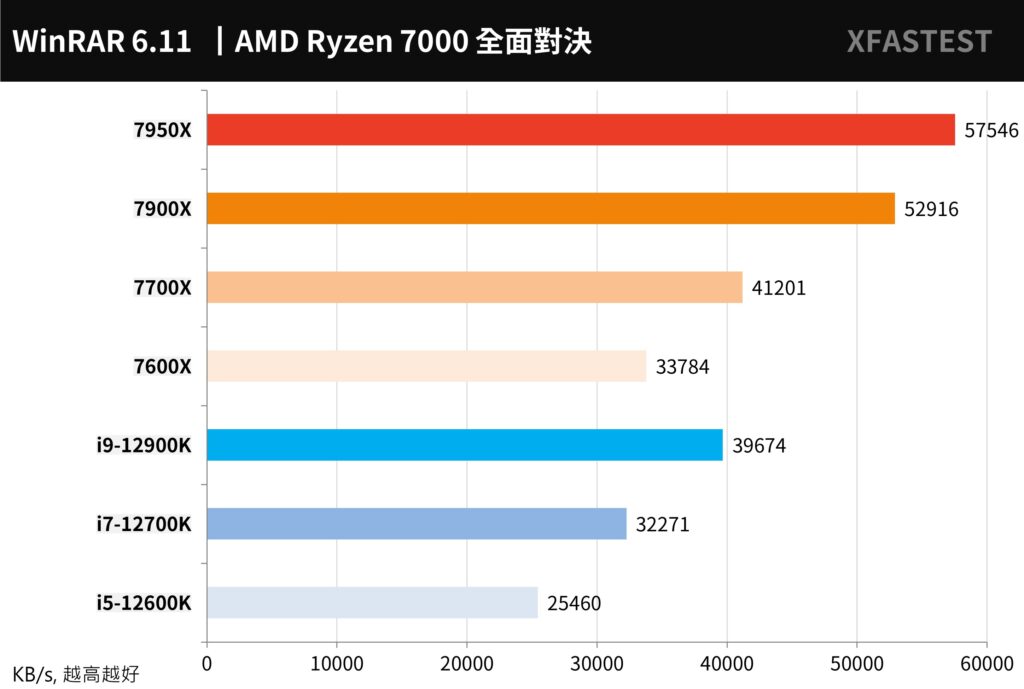
WinRAR is the most commonly used compression tool. In terms of performance, 7950X can reach 57546 KB/s, 7900X 52916 KB/s, 7700X 41201 KB/s, which beats i9-12900K’s 39674 KB/s, and 7600X’s 33784 KB/s.
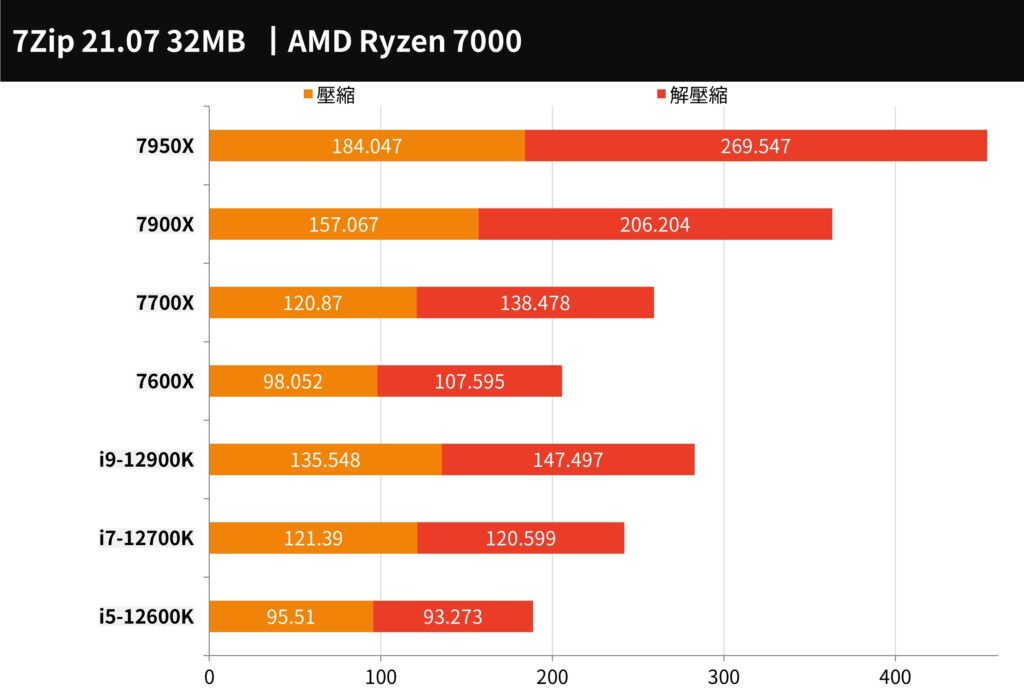
7-Zip is another well-known and free compression tool that can effectively utilize the performance of multi-core. In terms of GIPS performance of compression and decompression, the 7950X still wins the championship and far outperforms the i9-12900K.
PCMark 10, CrossMark, and Office PC benchmarks
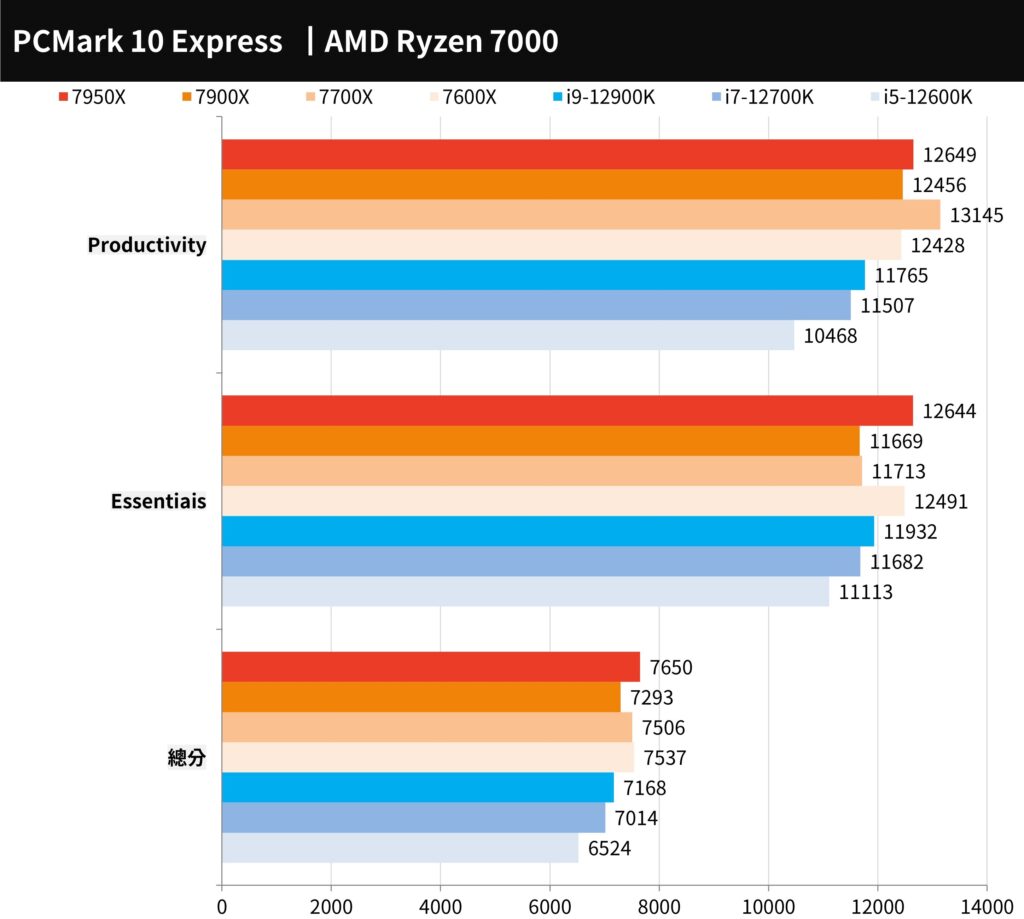
The overall performance of the computer is first tested with PCMark 10 Express, which can be used to score basic computer tasks in Essentials, such as app startup speed, video conferencing, and web browsing performance. The Productivity test uses spreadsheets and paperwork as test items.
The 7950X achieved a high score of 7650 points, 7900X 7293 points, 7700X 7506 points, and 7600X 7537 points, which all beat the i9-12900K’s 7168 points. But to be honest, these processors can absolutely satisfy the somatosensory pursuit of all users in terms of performance and response speed in terms of computer performance.
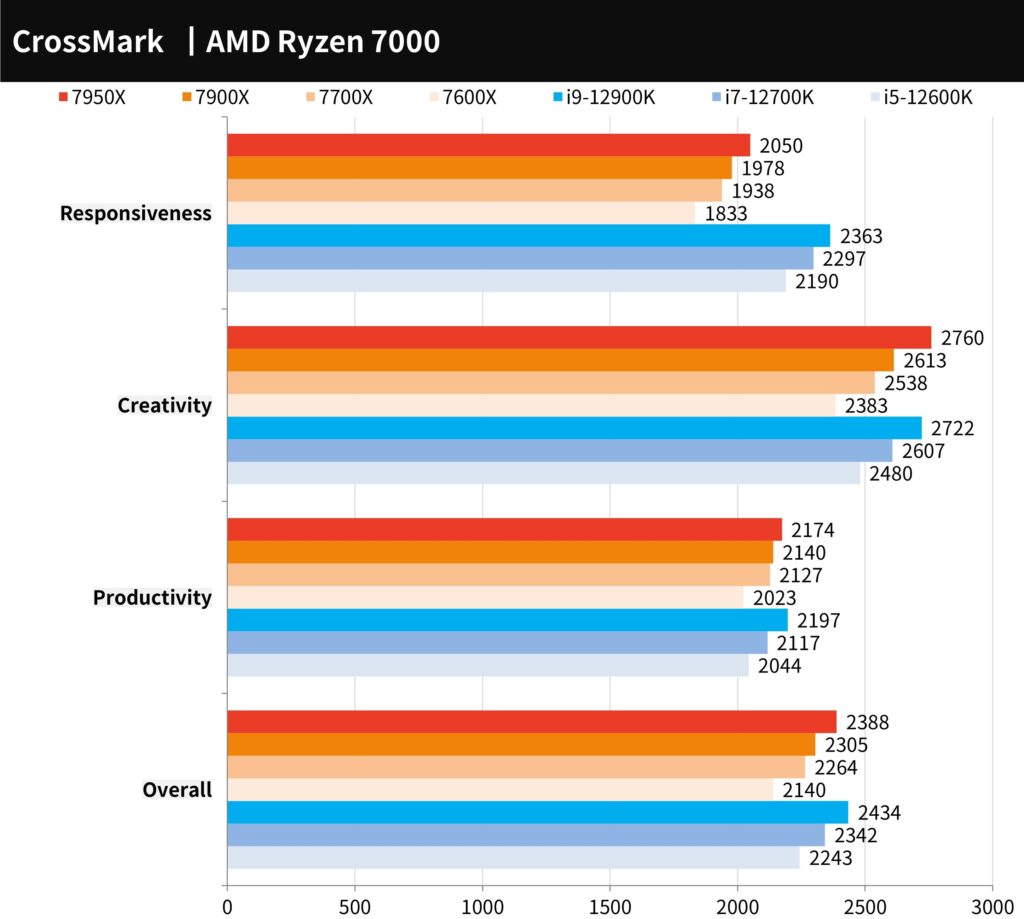
CrossMark, a cross-platform computer performance testing tool, is a free testing tool developed by BAPCo. It supports platforms such as Windows, iOS/iPadOS, macOS, and Android, and is aimed at computer productivity, such as text editing, spreadsheets, web browsing, Creative photo editing, organizing, and video editing work, plus computer response speed for testing.
7950X scored 2388 points, 7900X scored 2305 points, 7700X scored 2264 points, and 7600X scored 2140 points. Although it cannot beat Intel in this project, this generation has significant performance upgrades in productivity, creation, and response speed. It can be seen that this generation has the advantages brought by the clock upgrade and the architecture upgrade.
3DMark CPU performance and FS, TS benchmarks
Computer graphics game performance test tool 3DMark, the mainstream Direct X11 test Fire Strike, and Direct X12 Time Spy test.
Judging from the running scores, the 7950X scored 47806 points in Fire Strike, 7900X 42589 points, 7700X 3624 points, and 7600X 30360 points. As for the Time Spy test, the 7950X scored 19602 points in the CPU, 7900X 16370 points, 7700X 14395, and 7600X scored 10484 points.
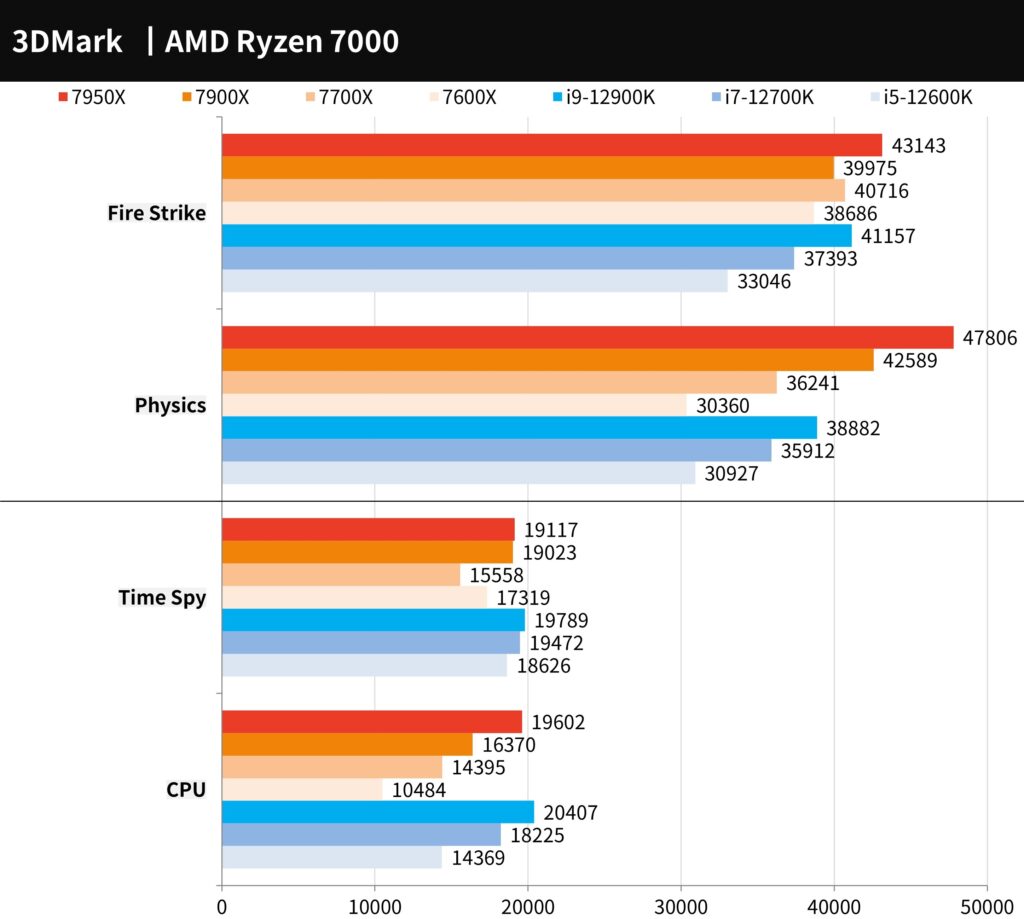
The 3DMark CPU test mainly tests the physical operation and custom simulation of the CPU and tests the performance of 1, 2, 4, 8, 16, and the maximum thread of the processor respectively, and the performance of more than 16 threads will belong to 3D Rendering, audio and video output will be used. Generally, Direct X12 games prefer 8T threads, and the following threads are the preferences of old games.
In the 1T-4T-test, the processor performance is quite close, but at 8T, the 7900X has 8047 points, which is better than the 7916 points of the i9-12900K, but when it is upgraded to 16T and MAX, it is 7950X and 7900X. There is no suspense to win the championship. It can be seen that the 7900X performs better in the Direct X12 game preference 8T thread.
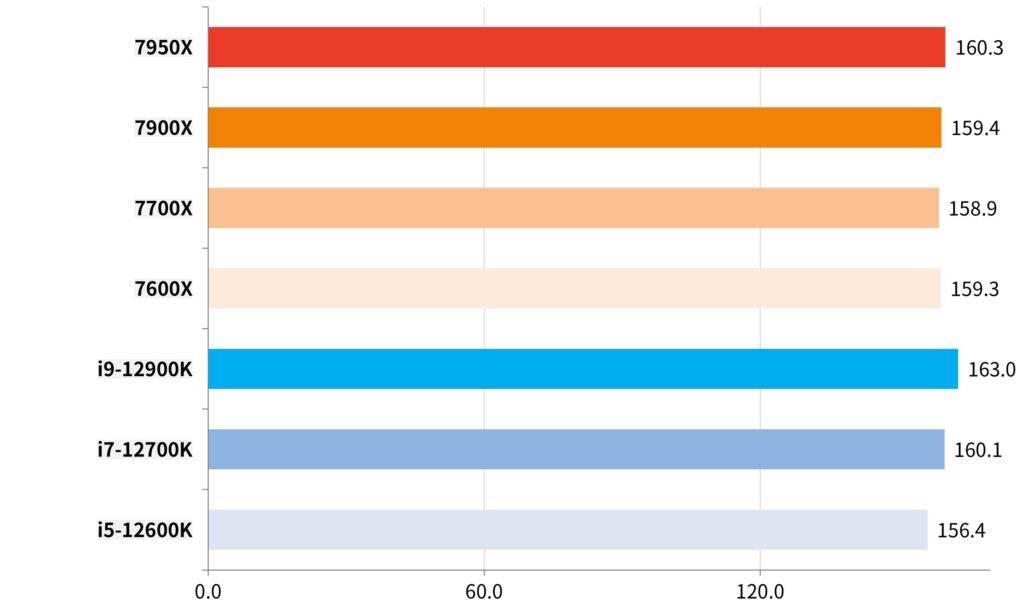
9+2 AAA gaming games on processor performance test
9 AAA game performance tests, including the entry-level “F1 2020” racing game, the adventure “Tomb Raider: Shadow,” “Horizon: Expecting Dawn,” and the performance-heavy “Edge Forbidden 3”, “Blood Killer 2”, “Assassin’s Creed: Viking Age,” and games such as “Polar Trench 6”, “Marvel Interstellar” and “Electric Traitor 2077” that support light pursuit.
The tests were conducted with the In-Game Benchmark test at 1080p resolution and the highest default settings of the game. Except for “Dian Yu Ke 2077”, which enabled DLSS acceleration, the rest of the games did not use DLSS or FSR acceleration.
Among the nine games, the 7950X achieved an average of 160.3 FPS, 7900X 159.4 FPS, 7700X 158.9 FPS, and 7600X 159.3 FPS, but slightly lost to the i9-12900 K’s 163 FPS, but tied with the i7-12700K and won the i5- 12600K.
E-sports games focus on the tactical and technical competition between players and teams, so they do not require much picture quality, which also allows such games to have a fairly high average FPS performance on high-end CPUs and GPUs, especially in 1080p resolution. Under the lower speed, the improvement of CPU performance and clock can increase the FPS performance of the game.
The test used two games, “Counter-Strike: Global Offensive” (CS: GO) and “Tom Clancy’s Rainbow Six: Siege” (R6), and tested at 1080p resolution and the highest settings of the game.
CS: GO game 7950X achieves the high performance of 763.5 FPS, 7900X 739.5 FPS, 7700X 737.7 FPS, 7600X also has 755.5 FPS; but R6 is the opposite, 7950X only 612 FPS, a small loss to i9-12900K’s 634 FPS.

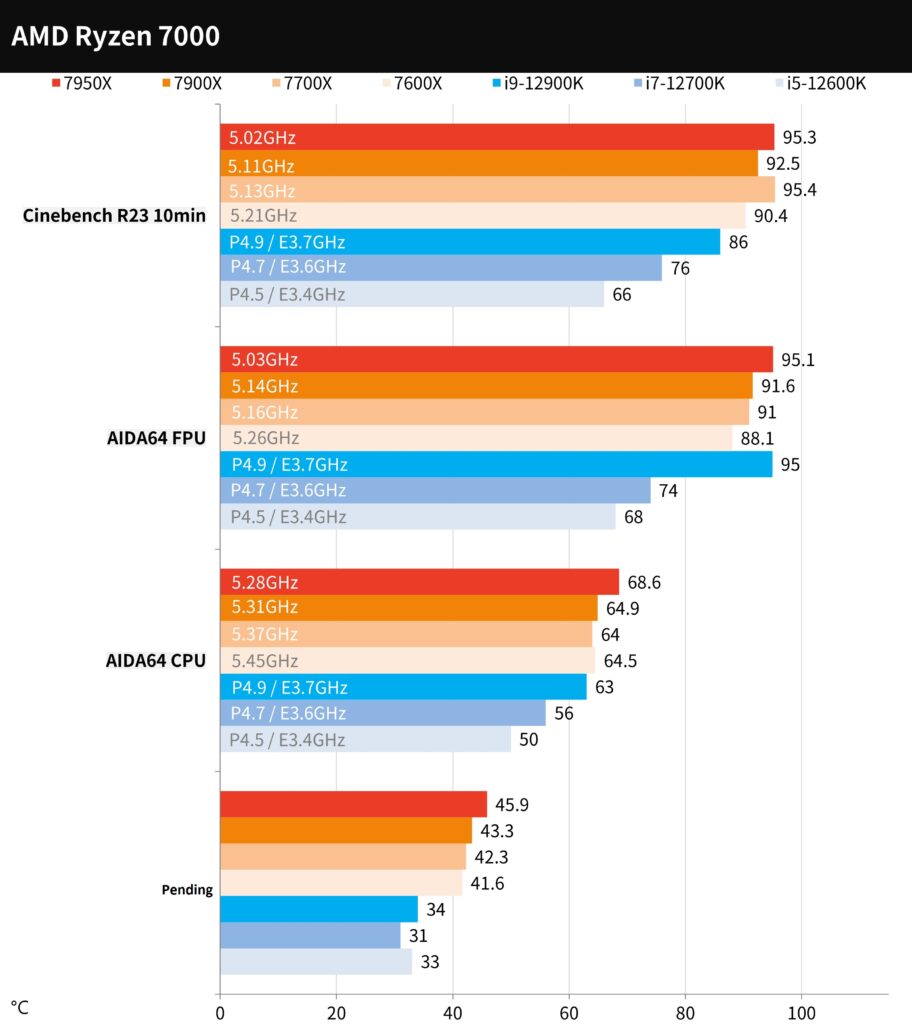
Ryzen 7950X and 7600X processor temperature and power consumption test
In terms of stress test, the test uses ROG STRIX LC II 280mm water-cooled radiator, fan and water pump with full speed settings, and compares AIDA64 CPU and FPU burn-in respectively; for general computer use, it is relatively close to the temperature performance of AIDA64 CPU test, while FPU test is the highest load with higher power consumption.
The AIDA64 CPU stress test is relatively close to the general computer usage. 7950X is pressed at 68.6°C under full-core 5.28GHz, 7900X 5.31GHz / 64.9°C, 7700X 5.37GHz / 64°C, 7600X 5.45GHz / 64.5°C. The temperature performance is close to the i9-12900K for comparison, but a little hotter than the i7 and i5.
Then under the AIDA64 FPU stress test, the 7950X clock was slightly reduced by 5.03GHz to the upper limit of the preset TjMAX temperature wall of 95.1°C, while the 7900X 5.14GHz / 91°C, 7700X 5.16GHz / 91°C, 7600X 5.26GHz / 88.1°C; the highest temperature is comparable to i9-12900K, but much higher than i7 and i5.
The temperature performance of Cinebench R23 is the same as the above-mentioned FPU in the same test, but the temperature of this generation of Ryzen 7000 is really increased a lot. It is recommended to use it with a water-cooled radiator of 240mm or more. Or make good use of Offset to drop the voltage to get better temperature performance.
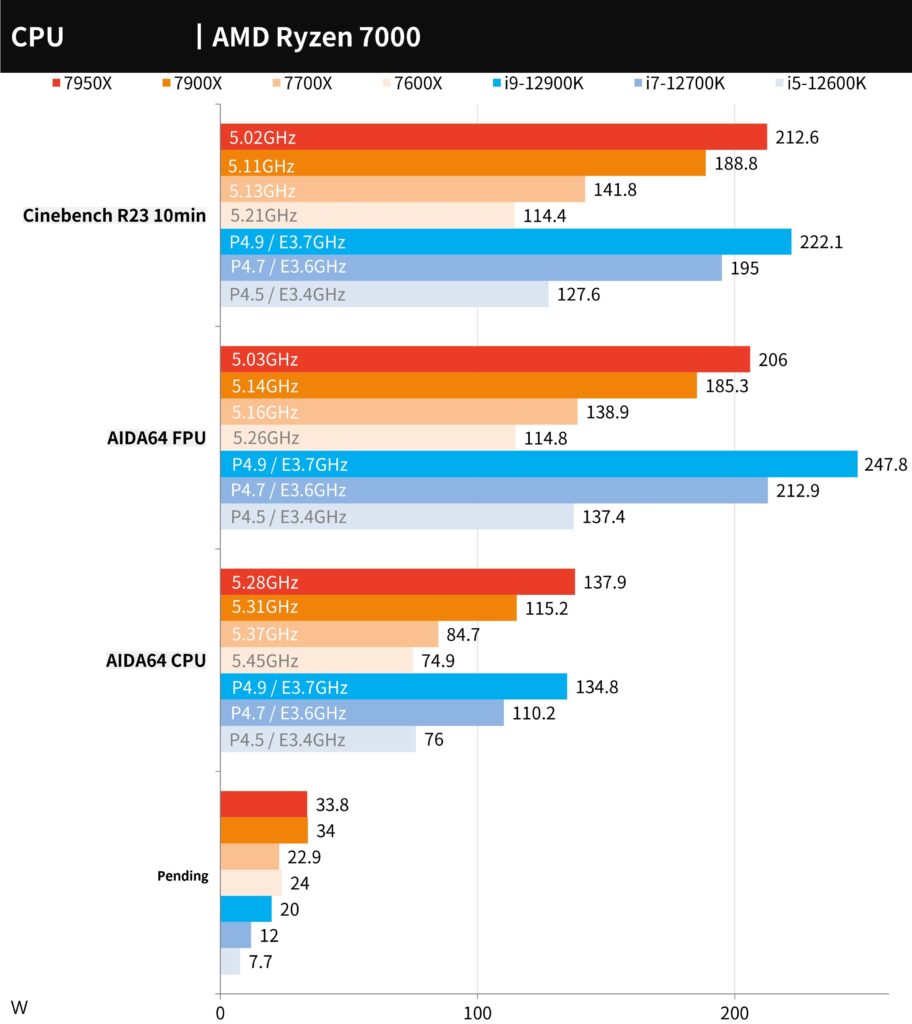
As for CPU power consumption, it is mainly based on CPU Package Power. Under the AIDA64 CPU test, 7950X reaches 137W, 7900X 115.2W, 7700X 84.7W, 7600X 74.9W, and the performance of i9, i7 and i5 is comparable. Then under the FPU stress test, 7950X came to 206W, 7900X 185.3W, 7700X 138.9W, 7600X 114.8W, but it still saves more power than Intel.
In this generation, the temperature and power consumption will increase due to the increase of the clock frequency. Players who choose 7950X and 7900X processors are recommended to reserve at least 300W for the processor and 400W for high-end graphics cards ( Flagship card 500W), at least 850W will be recommended, after all, there is still power for peripherals, RGB, fans, SSD, HDD, etc.
For 7700X and 7600X, the processor is around 200W, and the required power supply specifications are adjusted according to the matching graphics card.
Summarize
The new generation of AMD Ryzen 7000 processors has a significant increase in clock speed. Not only does the full core run above 5.0GHz, but the single core can reach a high clock of 5.7GHz Boost. Compared with the previous generation, it has a good performance improvement. But the current AMD strategy is to let Ryzen 7000 replace the existing Ryzen 5000 high-end products.
Therefore, in the AMD market, Ryzen 7000 is the flagship, high-end to the mainstream high-performance processor, while the original entry-level model is continued by Ryzen 5000. Therefore, in comparison, the Ryzen 7000 will undoubtedly compete with the 12th generation Intel Core. There’s even a future Gen 13 update to face.
In terms of performance, the two high-core Ryzen 9 7950X and 7900X face off against the i9-12900K in the middle, not only in multi-core, rendering, computer performance, and creation performance but also better than the i9-12900K, although they lose a little in-game performance. The difference is absolutely bearable.
However, the Ryzen 7 7700X and Ryzen 5 7600X with fewer cores will lose in multi-core and rendering performance when facing the i7-12700K and i5-12600K with more cores, but the overall computer performance and game performance can be said to be on an equal footing.
Therefore, in the US, the price of 7950X is higher at US$739.99, but the price of 7900X starts at US$589.99 to face the i9-12900K; it may be because there is no need to sacrifice in the first wave, so the price of 7900X is Pretty ok.
As for the price of 7700X US$419.60 and 7600X US$299, it is a few hundred dollars more expensive than the opponent. At present, the price is similar to that of the Ryzen 5000 era at that time, but in the absence of a complete win, the new Players also have to buy new X670 or B650 series motherboards and DDR5 memory, which also makes this generation of AMD upgrade barriers higher than previous generations.
But maybe after the 13th generation of Ryzen 7000’s real enemy is launched, and it is killed by Intel with the 12th and 13th generation products, it may really stimulate the aroma of the Ryzen platform. As for how AMD Zen 5 will break through in the future, let us continue to test it.
Please share this article with your friends on social media, and help you know the test result of the AMD Ryzen 7000 Full Versus 12th Generation Intel Core Processor Test Report Data.
This article is based on the personality of the reviews. You are responsible for fact-checking if the contents are not facts or accurate.
Title: AMD Ryzen 7000 Full Versus 12th Generation Intel Core Processor Test Report Data